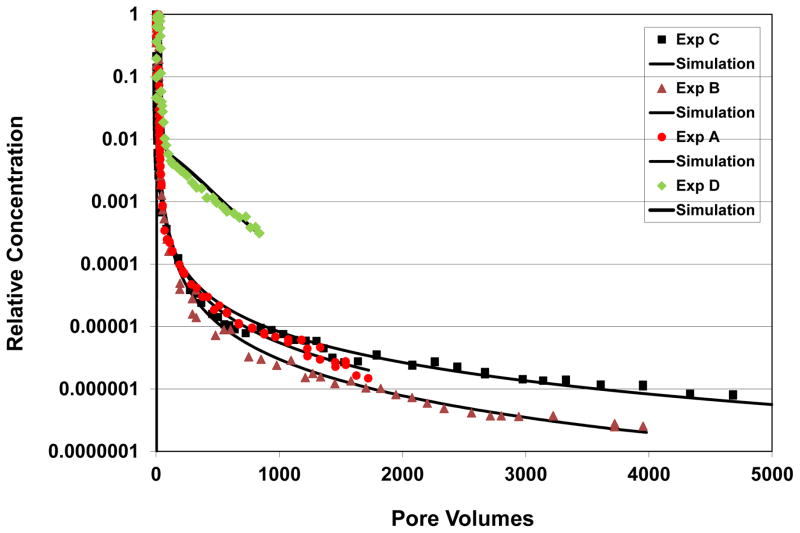
Figure 4.
Comparison of simulated and measured TCE and PCE transport; representative examples for non-baseline conditions (referenced to Table 1). Exp A has an input concentration of 68 mg/L; exp B has a pore-water velocity of 73 cm/h; exp C used soil that was aged with TCE for 30 days; exp D is for PCE rather than TCE. Note that the truncated elution curve for PCE is due to the low (1 mg/L) input concentration used for this experiment. Simulated curves are produced with a one-dimensional transport model for which sorption-desorption is represented by a continuous-distribution function.

