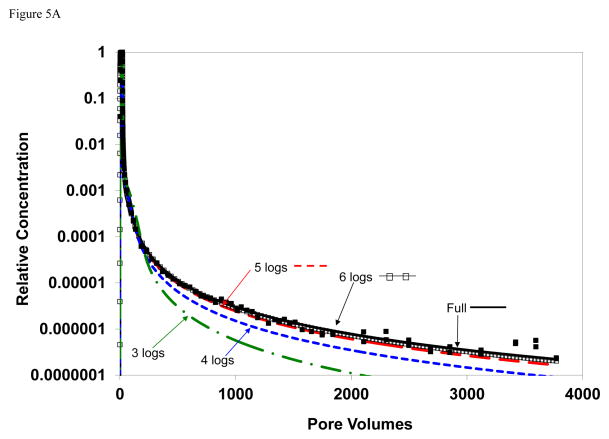
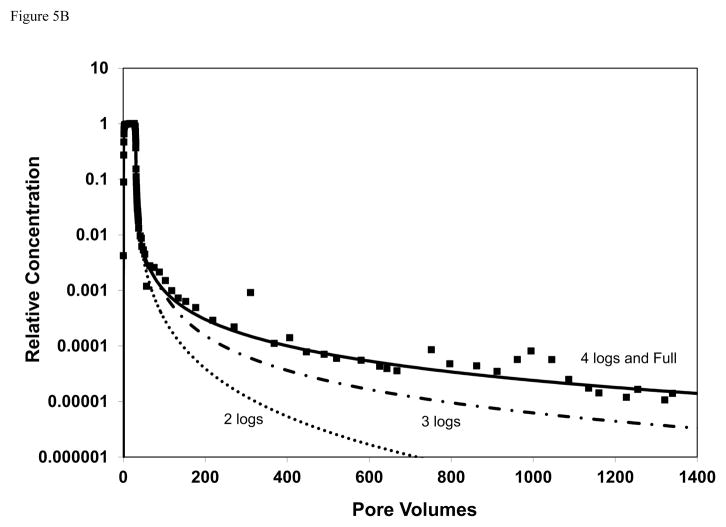
Figure 5.
Comparison of simulated and measured transport; simulations produced for cases wherein the extent of the elution tail used for model calibration was reduced. For example, the simulated curve for “3 logs” represents a case for which the measured elution curve was truncated at a relative concentration of 0.001 prior to calibration. The solid square symbols are measured data and the solid black curve represents the simulation for calibration to the entire elution curve. Simulated curves are produced with a one-dimensional transport model for which sorption-desorption is represented by a continuous-distribution function. A) TCE baseline conditions (row 1 of Table 1); B) Atrazine.


