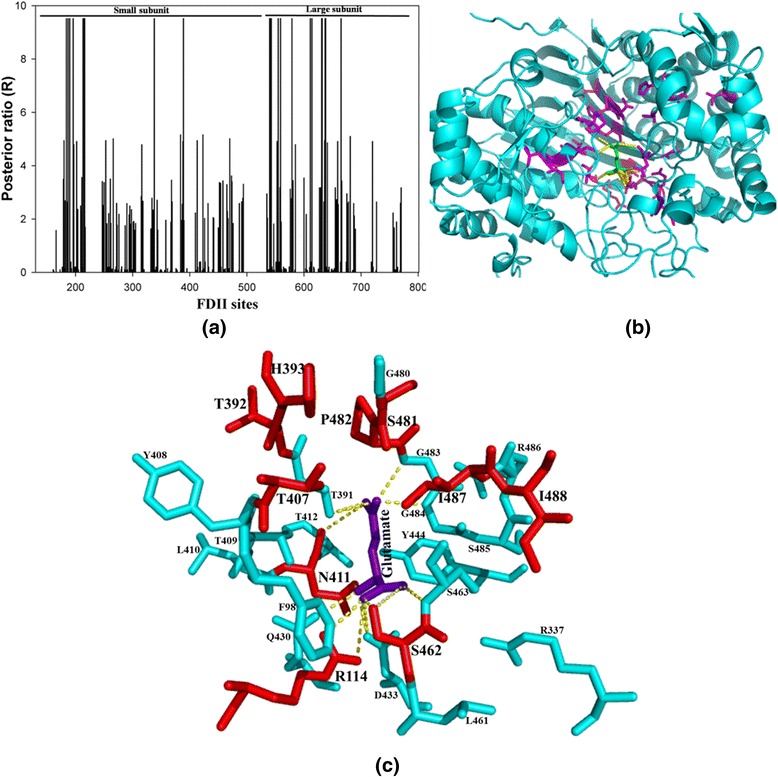
Fig. 3.

Type 2 functional divergence analysis for Bacteria 1 vs. Bacteria 4 extremophile. (a) Twenty two amino acids type 2 divergent sites are observed at posterior ratio (R) 9.5. The putative divergent sites are marked as a highest peak in figure. Nine sites are observed on large subunit and thirteen are on the small subunit. (b) The type 2 divergent sites predicted by DIVERGE 3.0 amino acids sites are mapped on GGT structure (cyan color) of E. coli (2DBX). The identified FDII sites are shown in stick (magenta) whereas the inbuilt glutamate substrate is shown in green stick. (c) The FDII sites identified in Bacteria 1 vs. Bacteria 4 extremophile cluster comparison are mapped on glutamate (violet) binding cavity (cyan color) of E. coli GGT within the 6 Å radius. Ten divergent sites (red color) out of twenty four type 2 predicted divergent sites are observed in binding cavity region of E. coli GGT
