Fig. 1.

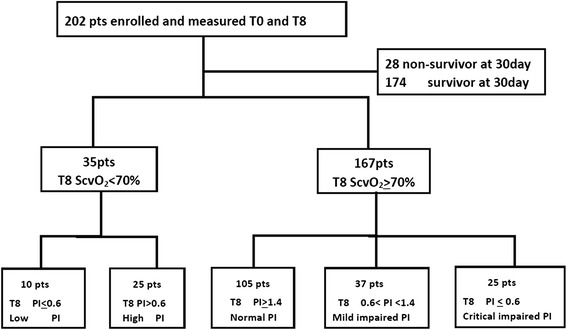
Flow diagram showing the 202 patients stratified according to central venous oxygen saturation (ScvO 2) and peripheral perfusion index (PI) at 8 h after resuscitation (T8). pts patients, T0 baseline

Flow diagram showing the 202 patients stratified according to central venous oxygen saturation (ScvO 2) and peripheral perfusion index (PI) at 8 h after resuscitation (T8). pts patients, T0 baseline