
Figure 6. Positron and proton peak energies.
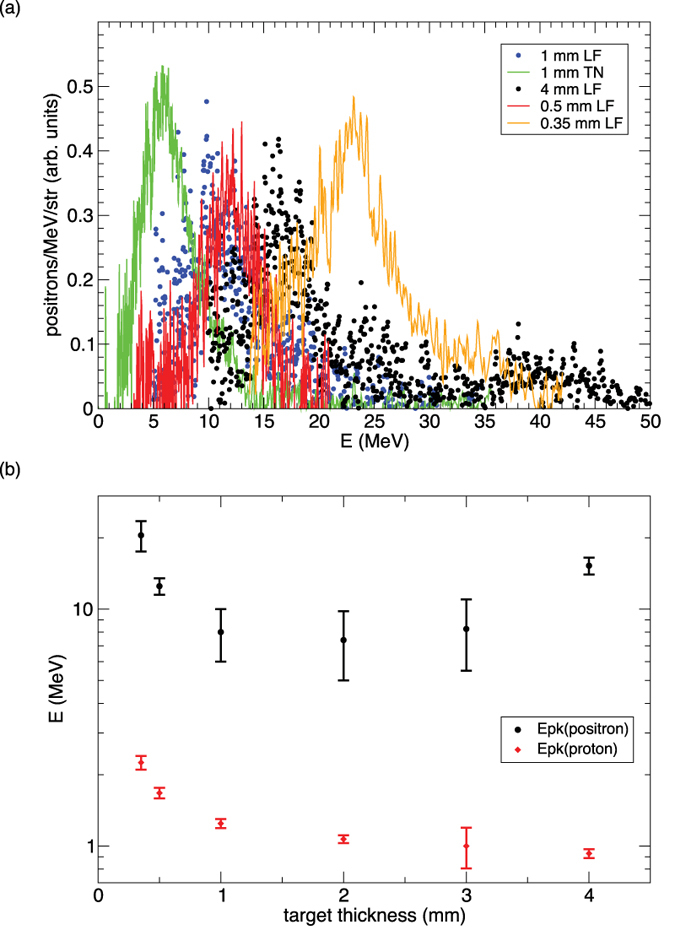
(a) Comparison of positron spectra for Au disks of different thicknesses and at different detector angles. Here LF refers to −8o and TN refers to +36o. Amplitudes have been renormalized to show all spectra on the same scale. (b) Thickness dependence of positron peak energy (black dot) vs. proton peak energy (red diamond) for Au disks. The positron peak energy reaches a minimum at ~2 mm thickness, while the proton peak energy decreases monotonically with increasing thickness. Each upper error bar corresponds to the highest peak energy measured near LF (−5o to −9o), and each lower error bar corresponds to the lowest peak energy measured near TN (+36o to +40o). Peak energy at LF is always higher than at TN (see Fig. 6(a)).