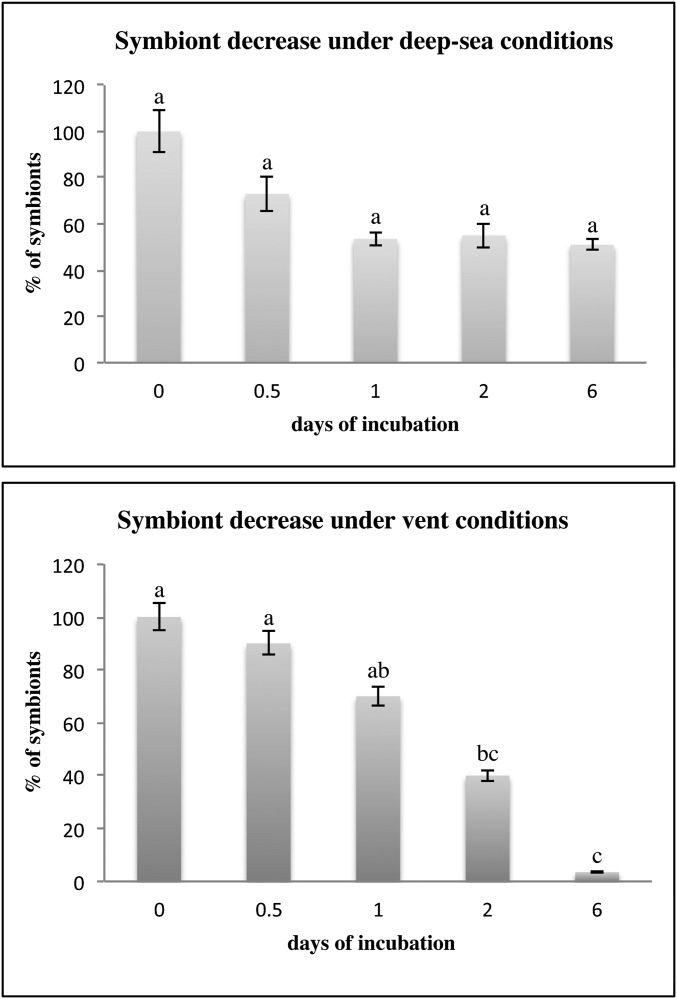
Fig. S3.
Symbiont decrease in number in the trophosome during simulated deep-sea incubations without flow and simulated flowthrough vent incubations of up to 6 d. All incubated and freshly fixed trophosome pieces were visually analyzed by transmission electron microscopy (fresh three specimens; 0.5 day cold two specimens and warm three specimens; 1 d cold two specimens and warm three specimens; 2 d cold and warm one specimen, each; 6 d cold one specimen and warm two specimens; Table S2). In detail, symbionts in a total of 30 transmission electron micrographs for each trophosome were counted, accounting for an area of 7,260 µm2 for each treatment and time point. Symbiont density is displayed as percent compared with fresh trophosome. Only samples from the cruise in 2011 are displayed. Letters give statistical differences of symbiont decrease in numbers in trophosome under simulated deep-sea conditions without flow and simulated flowthrough vent conditions over time of incubation. Percentage of symbionts is given in mean and SD of symbiont counts over 30 micrographs.

