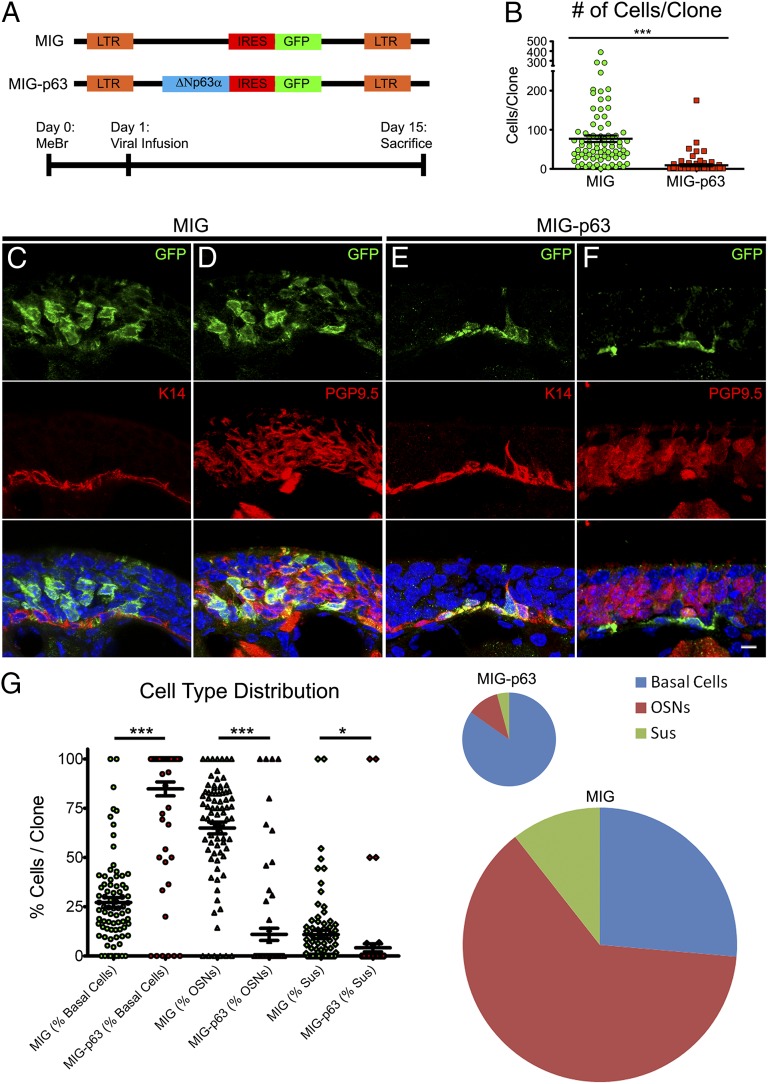
Fig. 3.
Down-regulation of p63 is necessary for HBC activation. (A, Upper) Schematics of retroviral constructs. (Lower) Experimental timeline. (B) Infection with MIG-p63 significantly attenuated the size of the resultant clones compared with empty vector, MIG-infected controls; ***P < 0.0001, Mann–Whitney test. (C and D) Representative clones resulting from MIG infection. Infection results in large clones including both simple clones, consisting of only one cell type (C), and complex clones, consisting of more than one differentiated cell type (D). (E and F) Representative clones resulting from MIG-p63 infection. MIG-p63 infection results in smaller, simple clones consisting of K14+ HBCs (E) and, rarely, smaller clones consisting of K14+ HBCs with very few PGP9.5+ OSNs (F). (Scale bar: 10 µm.) (G, Left) Quantitative analysis of cell type distribution by percentage of the contribution of each differentiated cell type to each individual clone. *P < 0.05, ***P < 0.0001; Kruskal–Wallis test. (Right) Pooled data of cell type contribution normalized to average clone size as indicated by pie chart size.

