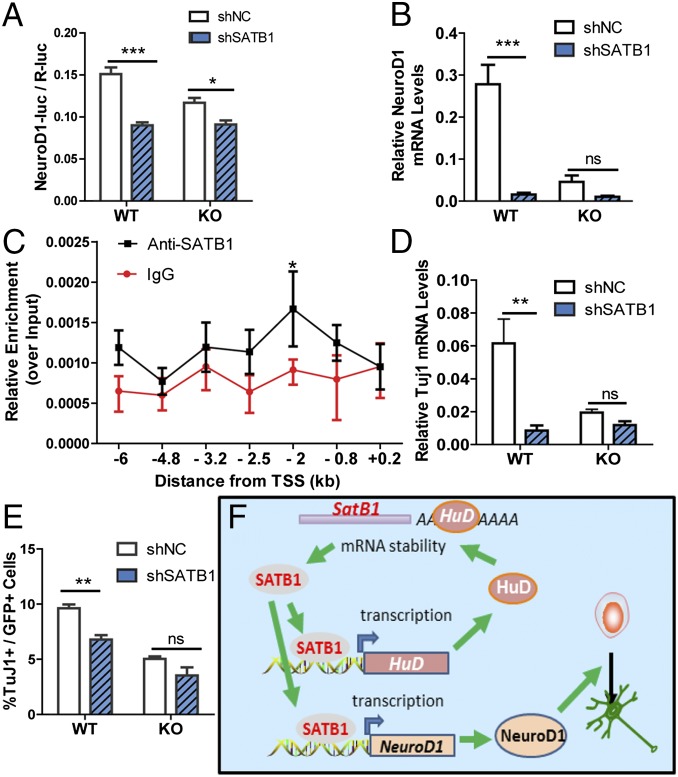
Fig. 6.
HuD and SATB1 form a positive regulatory loop that regulates neuronal differentiation through NeuroD1. (A) SATB1 knockdown led to decreased NeuroD1 transcription as assessed by NeuroD1 promoter-luciferase activity in differentiating NSCs. n = 3. P < 0.05 (interaction), two-way ANOVA with Bonferroni’s posttest. *P < 0.05; ***P < 0.001, post hoc analysis. (B) SATB1 knockdown led to decreased NeuroD1 mRNA levels. n = 3. P < 0.05, two-way ANOVA with Bonferroni’s posttest. ***P < 0.001, post hoc analysis. (C) SATB1-specific ChIP assay demonstrates enrichment of SATB1 protein at a genomic sequence 2 kb upstream of the NeuD1 TSS in NSCs. ChIPs with IgG rabbit served as negative controls. The enrichment was normalized to the input. Quantities of DNA were calculated using a standard curve generated from an input DNA. n = 3. *P < 0.05 (post hoc value), two-way ANOVA with Bonferroni’s posttest. (D and E) SATB1 knockdown led to reduced neuronal differentiation in WT NSCs with no further effect on HuD KO NSCs, as demonstrated by both Tuj1 mRNA level (D; n = 3, interaction P < 0.05) and immunostaining using neuronal marker Tuj1 (E; n = 3, interaction P > 0.05, two-way ANOVA with Bonferroni’s posttest.) **P < 0.01; ***P < 0.001, post hoc analysis. Data are expressed as mean ± SEM. (F) Model for the HuD and SATB1 regulatory network for the regulation of adult NSC neuronal differentiation through NeuroD1.

