Fig. S3.
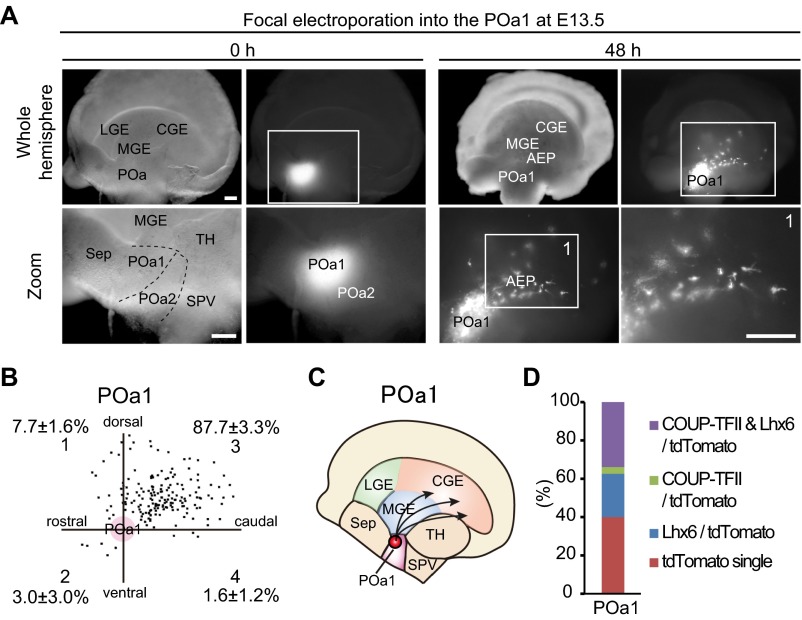
The migratory profiles of POa1-derived cells differ from those of POa2-derived cells. (A) Focal electroporation was performed into the POa1 of an E13.5 brain hemisphere and cultured for 48 h. Micrographs of the telencephalic hemisphere and of the site of electroporation, indicated by FITC-oligo DNA, are shown. POa1-derived cells tend to migrate caudally into the GE, but their migratory profile is more scattered than that of POa2-derived cells. (B) The distribution of POa1 cells. POa1 cells from five brains and 179 cells were dotted in the four sectors. The percentages shown in each sector are mean ± SEM. (C) Schematic diagram of the migratory profile of cells from the POa1. (D) Total proportions of cells expressing COUP-TFII and/or Lhx6. The percentage of cells expressing COUP-TFII is lower in the POa1 than in the POa2. [Scale bars, (A) 250 µm.]

