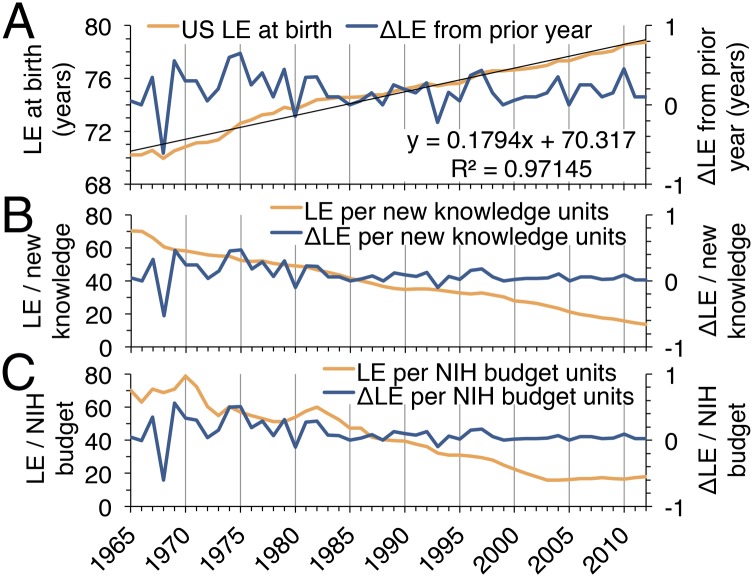
Fig. 4.
Alternative measures of biomedical research efficiency from 1965 to 2012. (A) Mean US life expectancy at birth (LE, blue line) and the yearly change in life expectancy (ΔLE, orange line). (B and C) LE and ΔLE for each divided by that year’s biomedical research publications (B) and NIH budget (C). ΔLE curves in B and C are not identical, but they appear similar at this scale due to the small differences between them.

