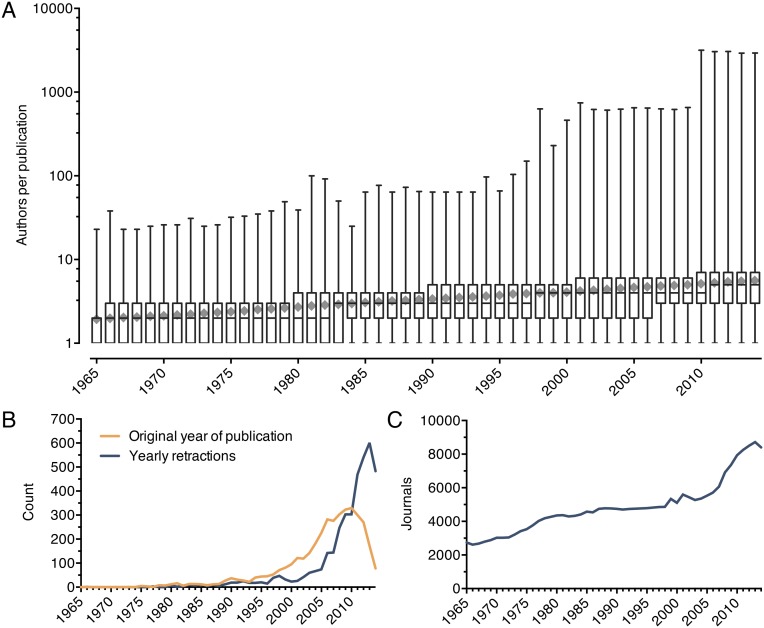
Fig. S1.
Authorship, retractions, and journals from 1965 to 2014. (A) Boxplots for each year show the minimum, interquartile range, median, and maximum number of authors per publication for all PubMed publications originating in that year. Gray diamonds show the mean number of authors per publication. (B) Retracted papers are plotted by their original publication year (orange) and by the year the retractions were made (blue). (C) The number of uniquely named journals with publications indexed in PubMed is shown from 1965 to 2014.

