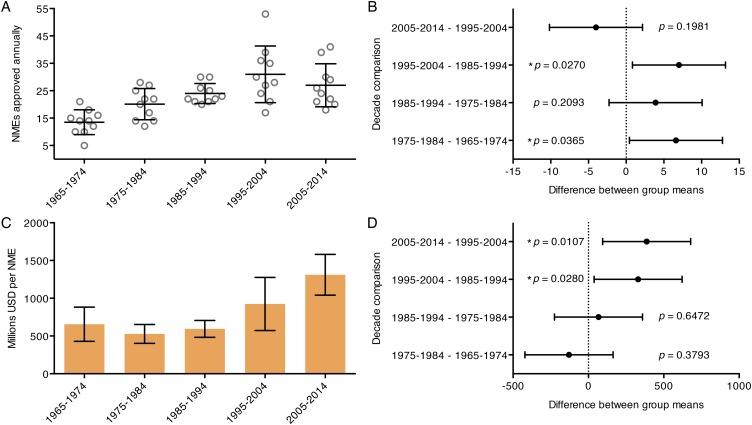
Fig. S3.
Annual NME approvals and costs by decade from 1965 to 2014. (A) The number of NMEs approved per year is plotted by decade from 1965 to 2014. Bars represent the mean and SD for each group. Decade means were significantly different from one another when compared using a standard one-way ANOVA (P < 0.0001). (B) Annual approved NMEs for each decade were compared with the subsequent decade using Fisher’s least significant difference test. The change in mean annual NMEs for each decade comparison is plotted with a 95% CI along with the respective P value. (C) The mean cost per NME, in millions of dollars of inflation-adjusted NIH budget, is shown by decade from 1965 to 2014. Error bars represent the SD. Decade means were significantly different from one another when the groups were compared using a standard one-way ANOVA (P < 0.0001). (D) Average cost per NME for each decade was compared with the subsequent decade using Fisher’s least significant difference test. The difference between the means for each comparison is plotted with a 95% CI along with the respective P value.

