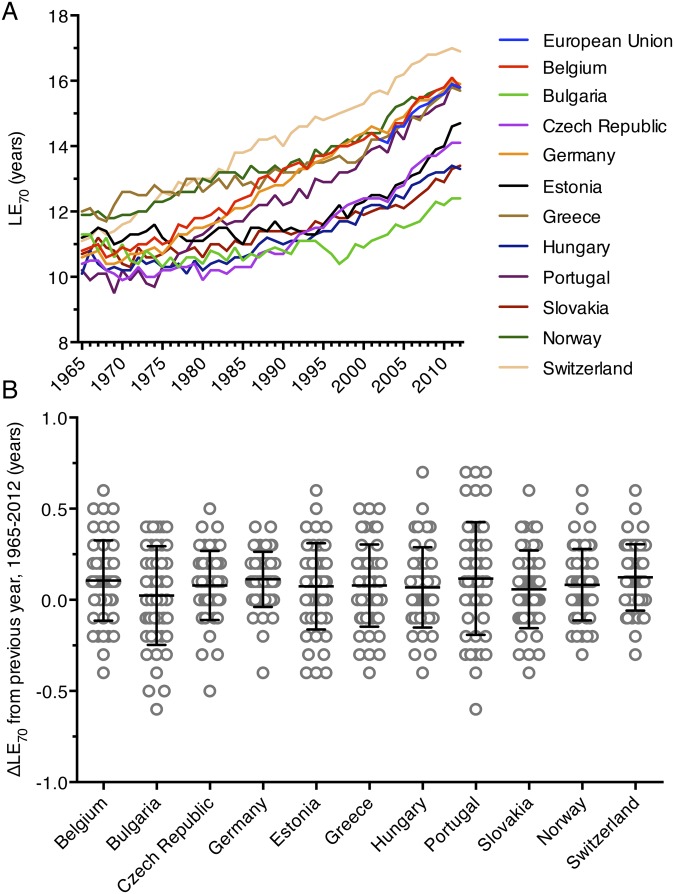
Fig. S6.
Growth in life expectancy at age 70. (A) Life expectancy at age 70 (LE70) is shown from 1965 to 2012 for 11 European nations along with data from the European Union from 2002 to 2012. (B) The yearly change in LE70 (ΔLE70) from 1965 to 2012 is plotted for the 11 analyzed European nations. Horizontal bars represent the mean ΔLE70, whereas error bars represent the SD.

