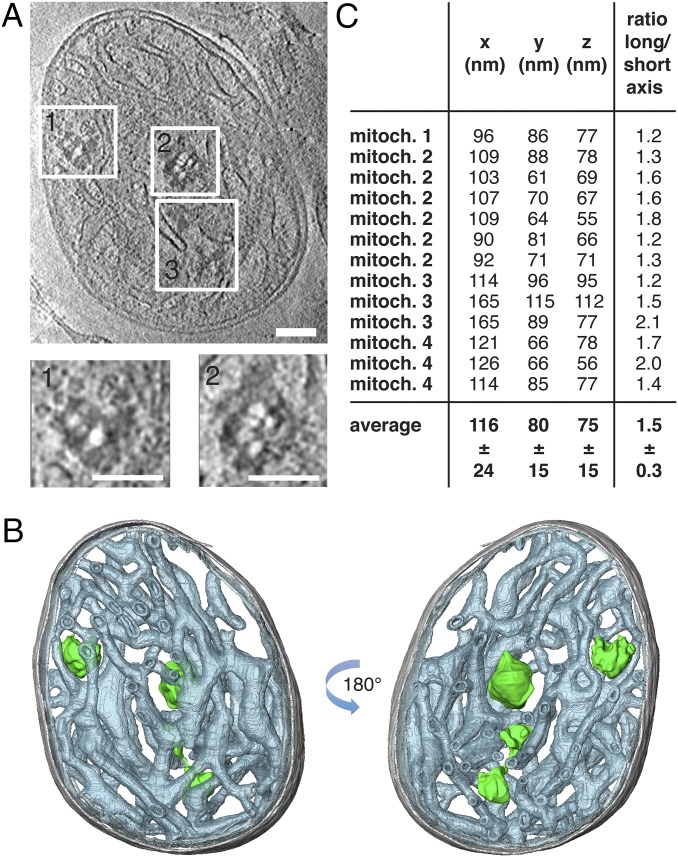
Fig. 4.
Mitochondrial nucleoids observed by cryo-electron tomography in situ are ellipsoid. (A) Tomographic slice through a whole bovine heart mitochondrion showing mitochondrial nucleoids (boxed areas). White blobs are gas bubbles, caused by the interaction of the electron beam with the biological material (28). (Scale bars: 100 nm.) (B) Segmented surface representation of A showing position of mitochondrial nucleoids (green) in a bovine heart mitochondrion. Green: nucleoids; gray: outer membrane; gray-blue: cristae. (C) Dimensions and long to short axis ratio of 13 nucleoids from four tomographic volumes of isolated bovine heart mitochondria (mitoch.) (n = 13). See also Movie S1.

