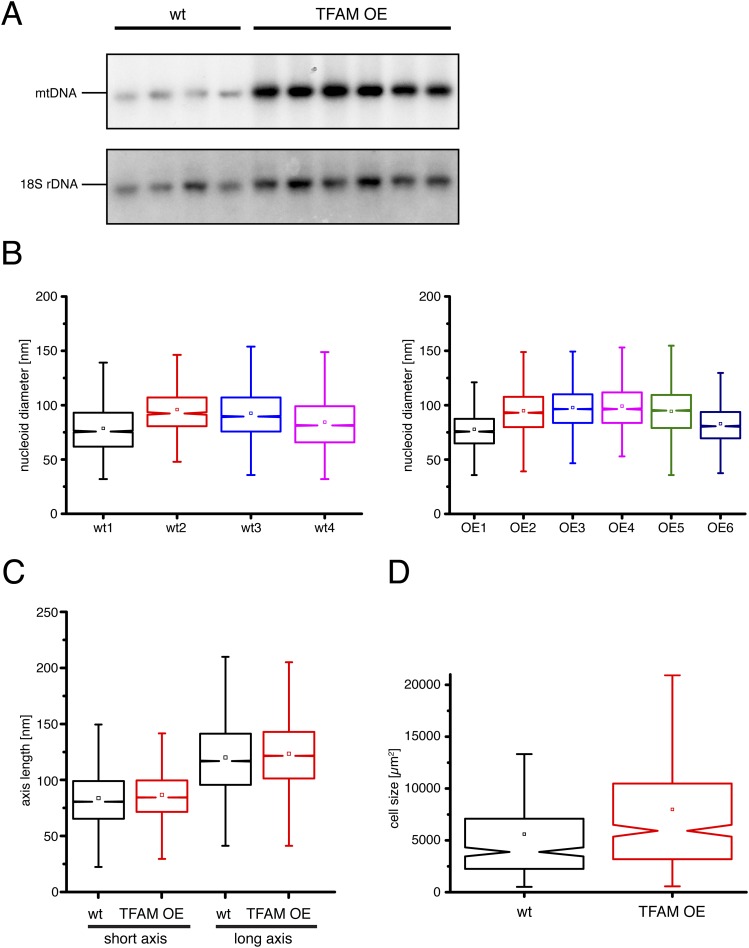
Fig. S3.
(A) Southern blot analysis of the mtDNA content in independent MEF lines. (B) Diameters of mitochondrial nucleoids imaged by STED microscopy for four independent wild-type (wt) and six independent TFAM OE MEF cell lines. (C) Quantification of the long and short axis length of nucleoids in MEFs imaged by STED microscopy. (D) Cell size of MEFs. n = 717 cells. wt: wild-type; TFAM OE: TFAM overexpressor. Notched boxplots: the boxed intervals contain the data points from the first to third quartiles of the distribution. With a size of 1.5 times the interquartile range, the whiskers encompass ∼99% of all data. The notches describe a confidence interval around the median, which equals the 95% confidence interval.

