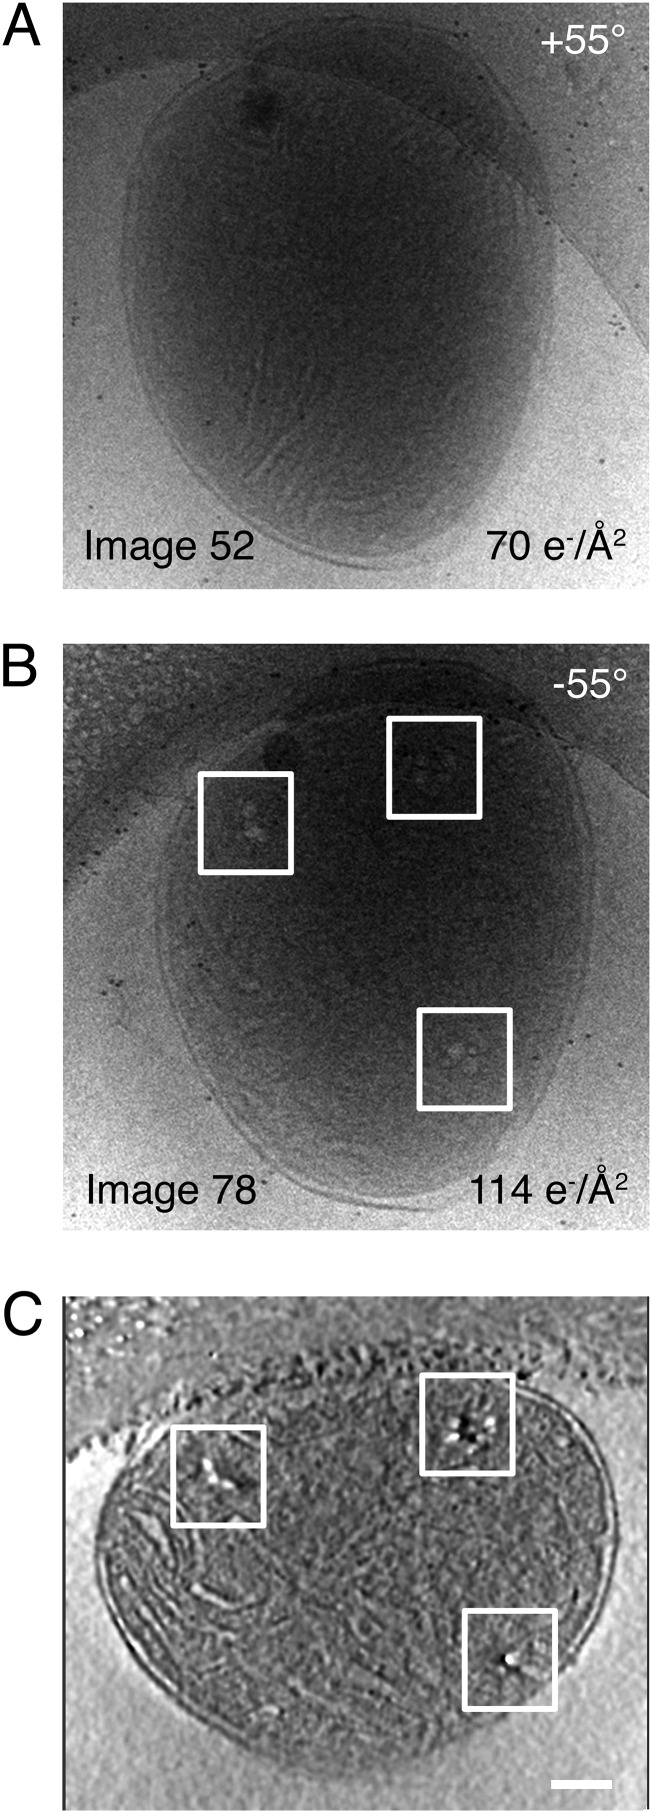
Fig. S4.
(A and B) Projection images #52 and #78 from a tomographic tilt series of a bovine heart mitochondrion showing mitochondrial nucleoids (boxed areas). The total number of projection images in the tilt series is 86. Total accumulated electron dose for the series was 130 electrons per Ångström squared (e−/Å2). The total accumulated electron dose for each image is displayed at the bottom right corner of the image. (C) Tomographic slice through a whole bovine heart mitochondrion showing mitochondrial nucleoids (boxed areas). (Scale bar: 100 nm.)

