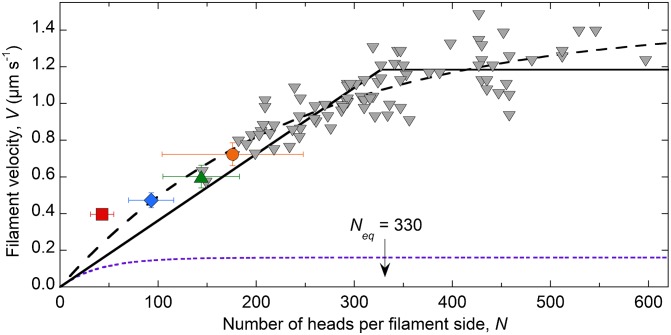
Fig. 3.
N dependence of SMM filament velocities moving in the inverted motility assay at 1 mM ATP. Red square, 26% SMM cofilaments; blue diamond, 51% SMM cofilaments; green triangle, 75% SMM cofilaments; orange circle, 100% SMM filaments. All colored points, n = 10. Gray triangles, 100% SMM filaments (Fig. 2I) (total n = 82). Fit to Eq. 2, dashed line (see the text). Fit to Eqs. 5 and 7, solid sloping line and solid horizontal line, respectively. The break between the two lines is Neq = 330 heads. Fits were determined using a Levenberg–Marquardt nonlinear least-squares parameter optimization method. See Table 1 for the fixed parameters and results of the fit. Detachment-limited prediction (Eqs. 2–4; see the text), dotted purple line, using k-AD = 21 s-1, katt = 0.49 s-1 per head-1, r = 0.023, ton = 0.048 s, and d = 8 nm.

