Fig. 1.
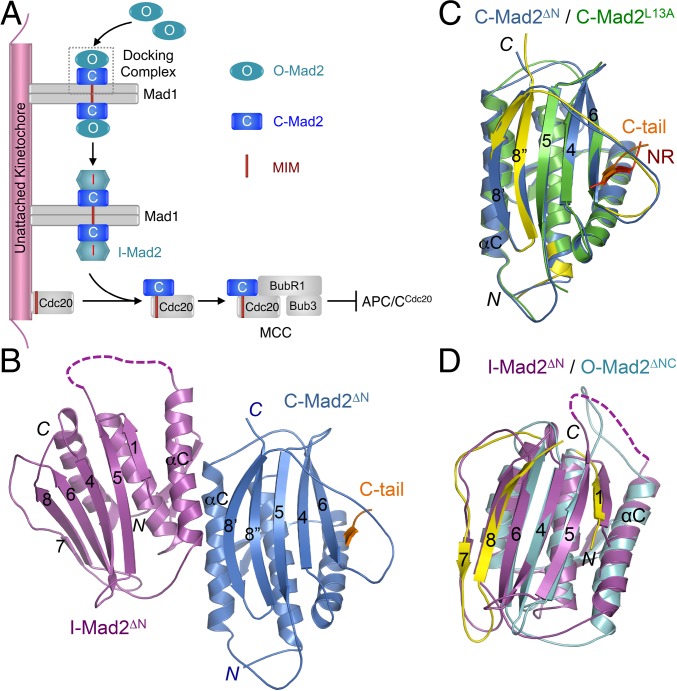
Crystal structure of the asymmetric I-Mad2–C-Mad2 dimer. (A) Model for conformational activation of Mad2 at kinetochores during mitosis. MCC, mitotic checkpoint complex; MIM, Mad2-interacting motif. (B) Diagram of the crystal structure of the asymmetric Mad2ΔN dimer, with the I-Mad2 and C-Mad2 monomers colored purple and blue, respectively. The entrapped C-terminal tail (C-tail) of another Mad2ΔN molecule through crystal packing interactions is shown and colored orange. (C) Superimposed diagrams of the C-Mad2 monomer in the Mad2ΔN dimer (blue) and the C-Mad2 monomer in the symmetric Mad2L13A dimer (green). The entrapped N-terminal region (NR) of another Mad2L13A molecule through crystal packing interactions is shown and colored red. The C- and N-terminal regions in Mad2L13A that underwent large conformational changes from O-Mad2 to C-Mad2 are colored yellow. (D) Superimposed diagrams of the I-Mad2 monomer in the Mad2ΔN dimer (purple) and the solution structure of O-Mad2ΔNC lacking both the N- and C-terminal 10 residues (cyan). All structural figures were generated with PyMol (https://www.pymol.org).

