Fig. 4.
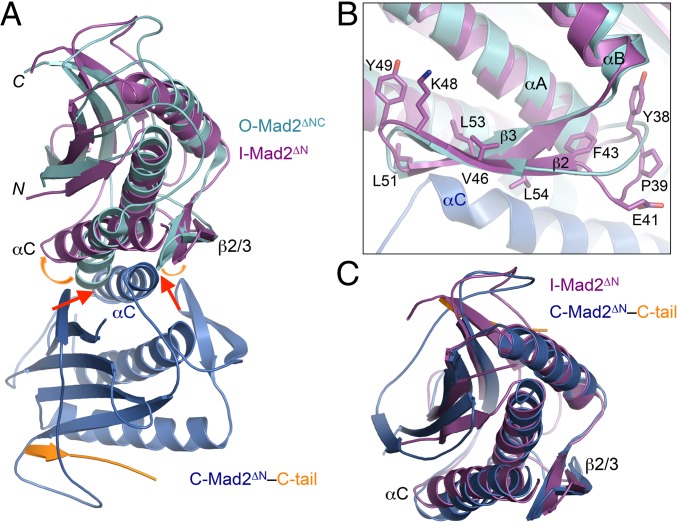
The I-Mad2 core more closely resembles the C-Mad2 core. (A) Superimposed diagrams of O-Mad2 (cyan) and the Mad2ΔN dimer with the C-Mad2 and I-Mad2 monomers colored blue and purple, respectively. Red arrows indicate steric clashes between C-Mad2 and O-Mad2. Orange arrows show relative movement of αC and β2/3 in I-Mad2. (B) Close-up view of the interface between the β2/3 hairpin of I-Mad2 and αC of C-Mad2, with residues targeted by mutagenesis in this study shown as sticks and labeled. Color schemes are the same as in A. (C) Superimposed diagrams of I-Mad2ΔN (purple) and C-Mad2ΔN (blue).

