Fig. 5.
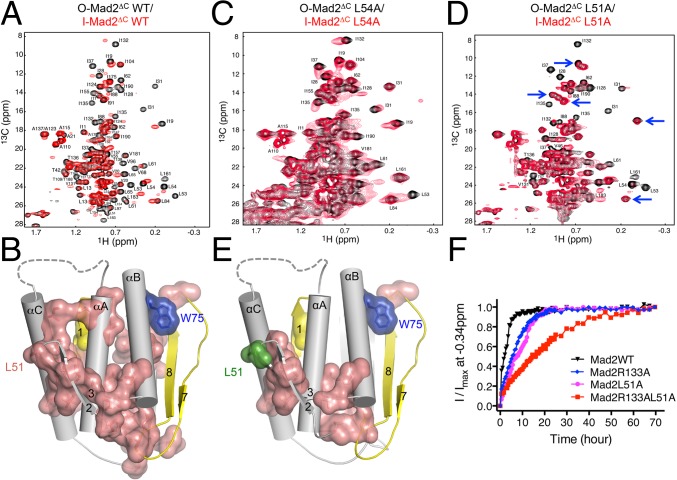
The β2/3 hairpin couples C-Mad2 binding to I-Mad2 formation and O–C Mad2 structural transition. (A) Overlay of the methyl region of the 1H/13C HSQC spectra of 13C-labeled O-Mad2ΔC (black) and 13C-labeled Mad2ΔC bound to unlabeled C-Mad2–MBP1 complex (red). The assigned methyl peaks in the O-Mad2 spectrum are labeled. (B) Diagram of I-Mad2 with the core colored in gray and the N- and C-terminal regions colored yellow. Residues whose methyl peaks in O-Mad2 are shifted by C-Mad2 binding are shown in van der Waals surface and sticks and colored in salmon. Two residues that are critical for maintaining the O-Mad2 conformation, L13 (yellow) and W75 (blue), are also shown. (C) Overlay of the methyl region of the 1H/13C HSQC spectra of 13C-labeled O-Mad2ΔC L54A (black) and 13C-labeled Mad2ΔC L54A bound to unlabeled C-Mad2–MBP1 complex (red). The assigned methyl peaks in the O-Mad2 spectrum are labeled. (D) Overlay of the methyl region of the 1H/13C HSQC spectra of 13C-labeled O-Mad2ΔC L51A (black) and 13C-labeled Mad2ΔC L51A bound to unlabeled C-Mad2–MBP1 complex (red). The assigned methyl peaks in the O-Mad2 spectrum are labeled. Blue arrows indicate representative unperturbed peaks. (E) Diagram of I-Mad2 with the core colored in gray and the N- and C-terminal regions colored yellow. Residues whose methyl peaks in O-Mad2 L51A are shifted by C-Mad2 binding are shown in van der Waals surface and sticks and colored in salmon. L51 is shown in green. (F) The O–C structural transitions of the indicated O-Mad2 proteins at 30 °C were monitored by a series of 1D 1H experiments, with each experiment lasting 30 min. The relative intensity of the methyl peak of V197 at −0.34 ppm was plotted against time. The nonlinear curve fitting with two-phase association was done with the program Prism.

