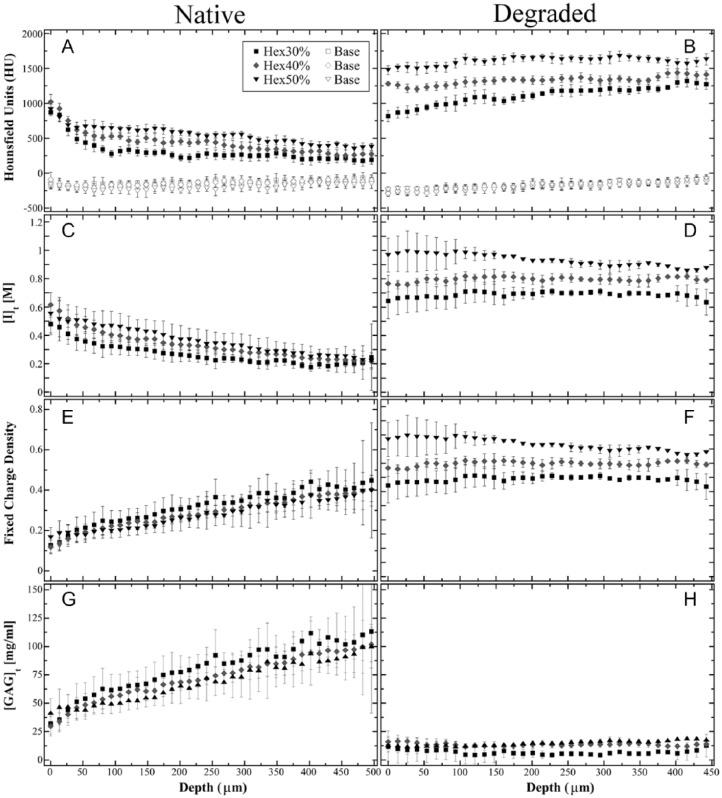
Figure 4.
The depth-dependent cartilage profiles after equilibration with Hexabrix (30%, 40%, and 50%) and the same “baseline” (open symbol) profile for native (A, C, E, G) and trypsin-degraded (B, D, F, H) samples. The HU profiles (A, B) are from the micro–computed tomography experiments. The diffusion of Hexabrix (C, D) is calculated from the calibration curve. The fixed charge density (E, F) and glycosaminoglycan (G, H) profiles are calculated based on quantitative contrast-enhanced micro–computed tomography.

