
Figure 4. Effect of Nox4 overexpression on myocardial hypertrophy.
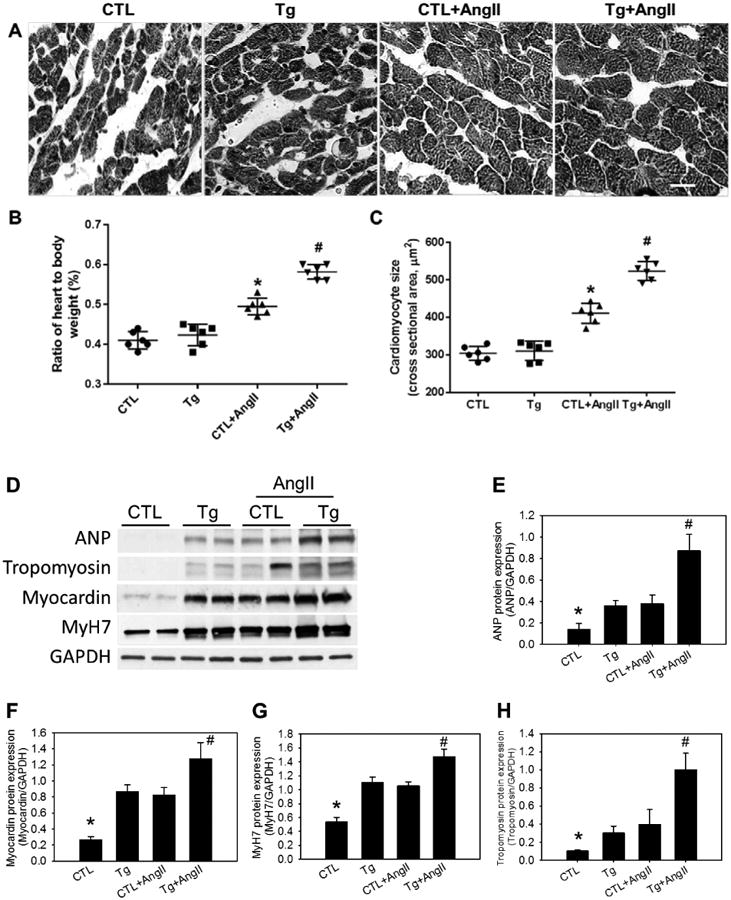
A, Representative microphotographs of cross-sectional views of the LV with Hematoxylin and Eosin staining (see Online Supplemental Figure 12A for a color version of Figure 4A). the white bar indicates 20 μm. B, The ratio of heart weight to body weight (%). C, Mean cross-sectional areas of cardiomyocytes. D - H, Protein expression of markers of cardiac hypertrophy including ANP, myocardin, MyH7, and tropomyosin in LV detected by Western blotting (D), and quantification analyses (E - H). In B and C, *P < 0.05 vs the rest of the groups, #P < 0.01 vs the CTL and the Tg. In E - H, *P < 0.01 vs the rest of the groups. #P < 0.01 vs the Tg or CTL+AngII, no significant difference between Tg and CTL+AngII. GAPGH was used as internal control. n = 6.