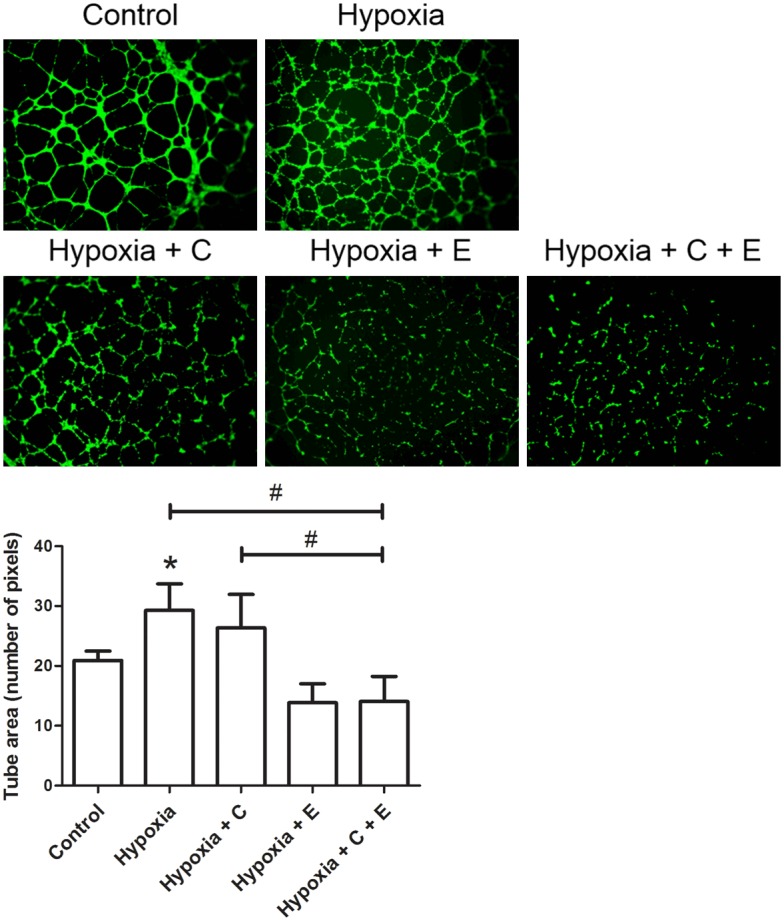
Figure 3.

Tube formation ability of HUVEC cells. Cells were treated with Control: in normoxic condition (20% O2, 5% CO2 and 75% N2) without any drug treatment, Hypoxia: in hypoxic condition (1% O2, 5% CO2 and 94% N2), Hypoxia + C: in hypoxic condition and 6 μM cisplatin, Hypoxia + E: in hypoxic condition and 10 nM everolimus, and Hypoxia + C + E: in hypoxic condition, 6 μM cisplatin and 10 nM everolimus. Upper panel: Representative fluorescence images (magnification: 400 ×) of tube formation of cells in Geltrex™ Reduced Growth Factor Basement Membrane Matrix. Lower panel: Bar chart presenting the tube area (number of pixels) of HUVEC cells under different treatment. Data were presented as means ± SD from three independent experiments and statistical analysis were performed by one-way ANOVA. *P<0.05 versus Control. #P<0.05 of Hypoxia + C + E versus Hypoxia or Hypoxia + C.
