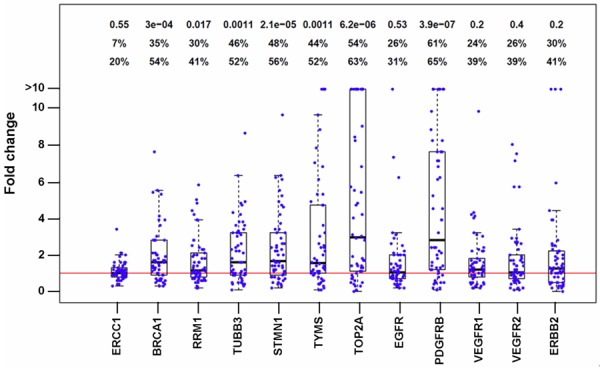
Figure 3.

Gene expression differences between tumor and adjacent normal in each patient. Expression difference is expressed as fold change between tumor and adjacent normal. Each dot represents one patient. Box plots are also shown for each gene. The p-value and percentages of patients with FC ≥1.5 and ≥2.0 are shown on the top to the chart.
