
Figure 1.
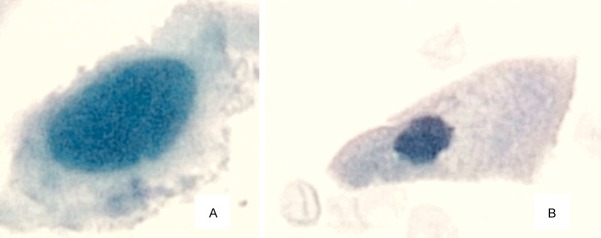
Comparison of a bladder cancer cell and normal bladder lining cell at the same magnification (60x). Panel “A”: A urothelial carcinoma cell exhibits a large nucleus and high nuclear: cytoplasmic ratio compared with Panel “B”: A normal urothelial cell that lines the bladder.