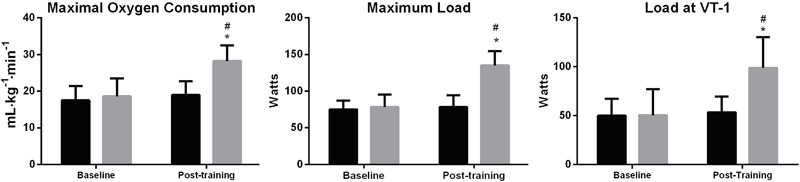
Figure 3. Parameters of physical fitness testing. Control group: black bars; Experimental group: gray bars. Data are reported as means±SD. *P≤0.05 compared to baseline; #P≤0.05 compared to control group (two-way repeated measures ANOVA with a Duncan post hoc test).