Figure 1.

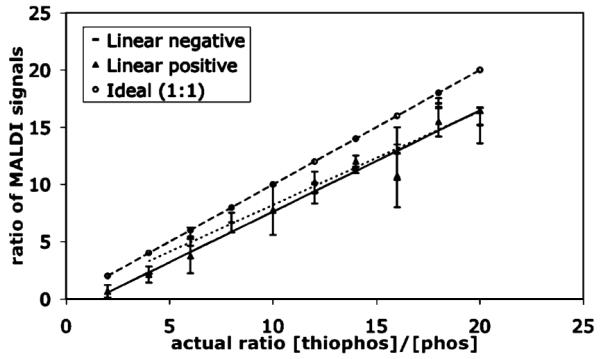
Calibration curve representing signal intensity ratios of thiophosphopeptide to phosphopeptide in both linear positive and negative modes (calculated as area under the curve) compared to the ideal ratio.

Calibration curve representing signal intensity ratios of thiophosphopeptide to phosphopeptide in both linear positive and negative modes (calculated as area under the curve) compared to the ideal ratio.