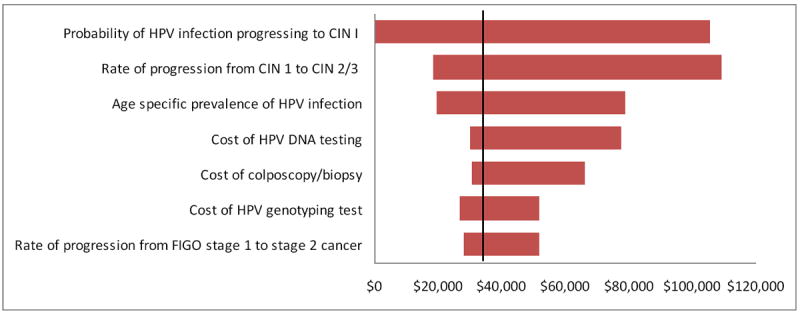
Figure 3.

Tornado Diagram: One-way sensitivity analysis showing the range of incremental cost-effectiveness ratios comparing LBC and HPV co-screening with genotyping and LBC and HPV co-screening. The vertical dotted line represents the base-case analysis ICER.
