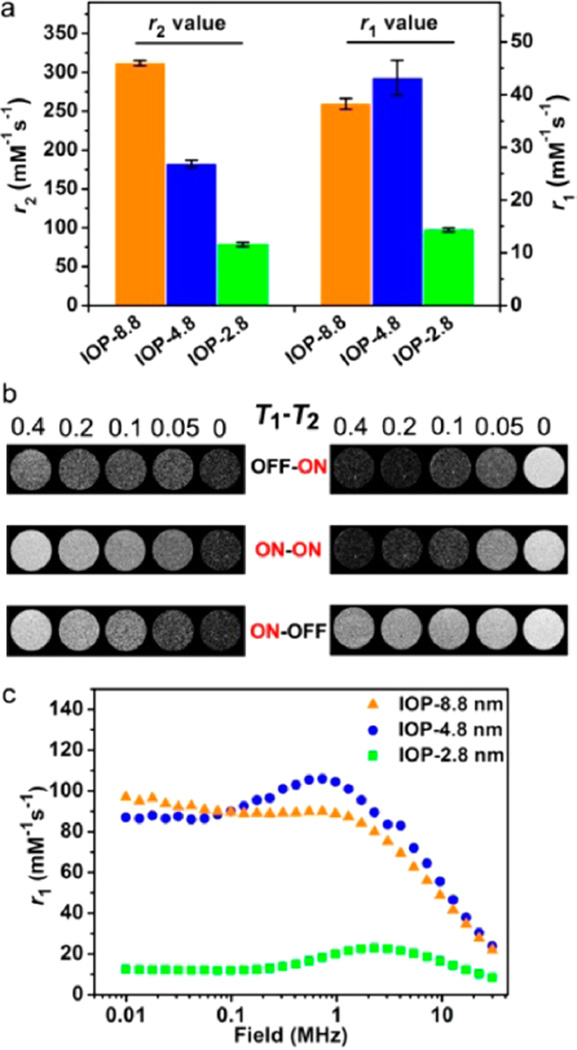
Figure 4.
MRI relaxivity and phantom study. (a) Columns to show the r1 and r2 values (0.5 T) of the three nanoplates, respectively. (b) T1 (left) and T2 (right) MRI phantom studies (0.5 T) of the IOP-8.8 (top), IOP-4.8 (middle), and IOP-2.8 (bottom) at different iron concentrations (mM) in 1% agarose. The capability of displaying T1 or T2 contrasts is denoted as ON for good contrast and OFF for poor contrast. (c) T1 NMRD profiles of the three nanoplates as the function of applied magnetic fields, measured by aqueous colloidal suspensions of each samples.

