
Figure 5.
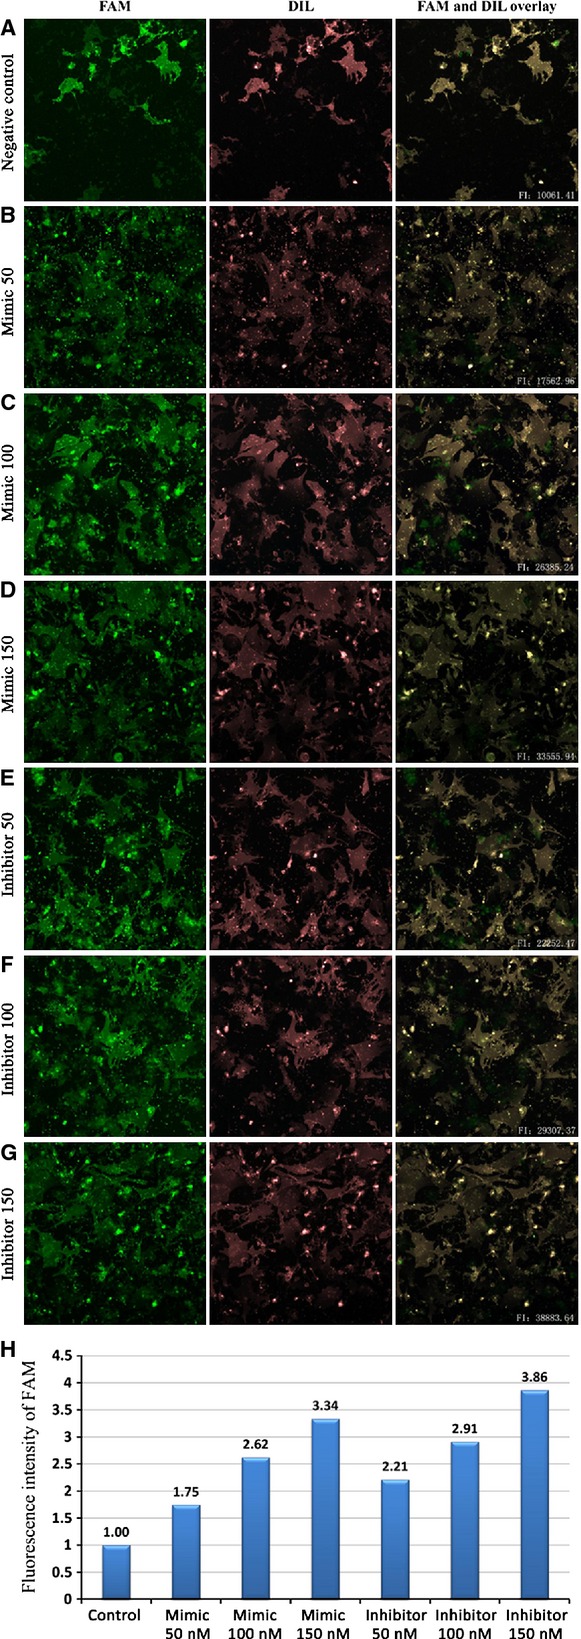
Setting cell membrane of the transfected cardiomyocytes labelled by the membrane fluorescence probe Dil as the boundary, the fluorescence intensity of FAM in the transfected cells were measured by the Cellomics ArrayScan™ Vti. FAM fluorescence (lane 1), Dil staining of cell membrane (lane 2), In the overlays (lane 3), FAM signal are visualized in green, Dil staining of cell membrane are in red. The fluorescence intensity of FAM signal was measured within the scope of the red fluorescence of Dil staining. The rows are scramble miRNA (A; negative control), mimic 50 nM (B), mimic 100 nM (C), mimic 150 nM (D), inhibitor 50 nM (E), inhibitor 50 nM (F) and inhibitor 150 nM (G). The H row show that the intracellular fluorescence intensity improved with the increase in miR-181c mimic/inhibitor concentration. These images are not scaled to the same intensity range. Fluorescence intensity was normalized by negative control intensity. FI: fluorescence intensity.