
Figure 1.
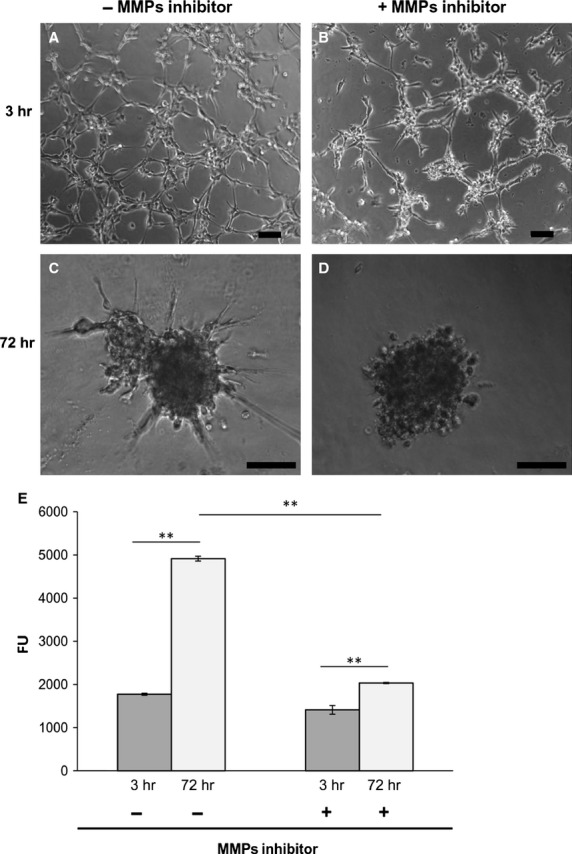
Matrigel invasion assay. (A–D) Phase contrast images of cells on Matrigel layer at indicated time-points; scale bar: 100 μm. (E) Endogenous collagenases activity indirectly measured by fluorescence emitted by DQ™ Gelatin degradation at indicated time-points. Data represent mean of three independent experiments ± S.D. **P < 0.01.