Figure 2.

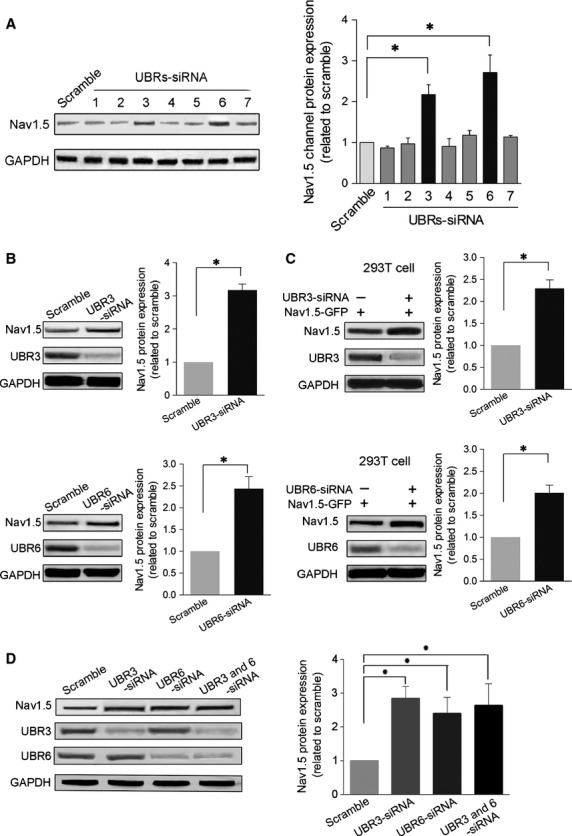
Protein expression of Nav1.5 channels in UBR knockdown cells. (A) Left. A typical example of a Western blot is shown using anti-Nav1.5 antibodies to assess the expression of Nav1.5 channel protein in NRVMs receiving different UBR siRNAs. Only UBR3/6 knockdown significantly changed Nav1.5 channel expression. GAPDH served as a loading control. Right. The pooled and quantified Western blot data. (B) Western blot analysis of Nav1.5 channels in UBR3/6 knockdown NRVMs. UBR3/6 significantly increased Nav1.5 expression in NRVMs. Upper. Western blot analysis and pooled data for Nav1.5 channels and UBR3 protein expression with or without transfection of UBR3 siRNA. GAPDH served as a loading control. Lower. Western blot analysis and pooled data using anti-Nav1.5 and anti-UBR6 antibodies to analyse Nav1.5 channel expression with or without transfection of UBR6 siRNA. GAPDH served as a loading control. (C) Western blot analysis in HNK293T cells expressing Nav1.5 channels after UBR3/6 knockdown. UBR3/6 could significantly increase Nav1.5 expression. Upper. Western blot and pooled data for Nav1.5 channels and UBR3 proteins level in HNK293T cells expressing Nav1.5 channels with or without UBR3 siRNA. GAPDH served as a loading control. Lower. Western blot analysis and pooled data using anti-Nav1.5 and anti-UBR6 antibodies to analyse Nav1.5 channel expression in HNK293T cells expressing Nav1.5 channels with or without UBR6 siRNA. GAPDH served as a loading control. (D) Western blot analysis of Nav1.5 channels in NRVMs. Cell were transfected with UBR3 and UBR 6 siRNA either alone or combined together. The scramble control RNA served as the control. Left. A typical example of a Western blot image for Nav1.5 channels and UBR3/6 protein expression. GAPDH served as a loading control. Right. Quantitative data for Western blots. All the data are from three independent experiments, *P < 0.01.
