
Figure 1.
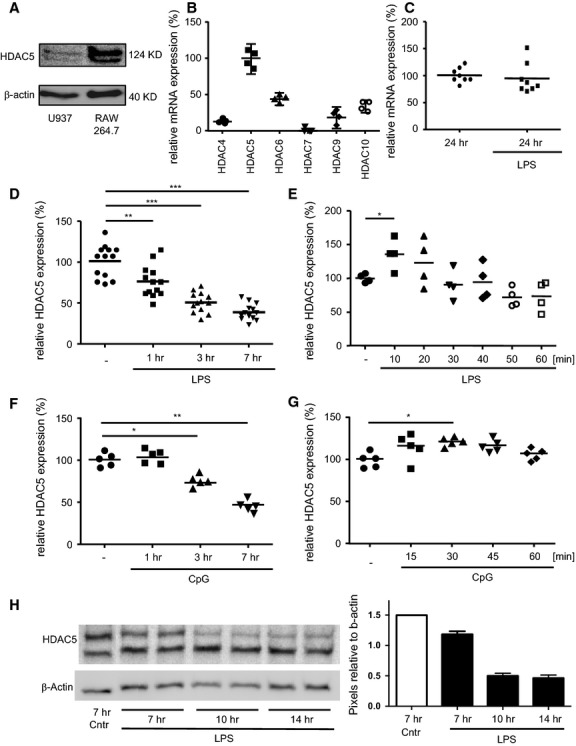
Expression levels of HDAC5 in murine and human macrophages. (A) Lysates from untreated RAW264.7 (105) or U937 (6.6 × 10⁴) cells were analysed by Western blot for HDAC5 and β-actin as loading control. Approximate protein sizes are indicated. Representative image of 4 (RAW264.7) or 2 (U937) independent experiments. (B) RAW264.7 cells were left untreated and mRNA levels of class II HDAC were determined by qPCR relative to HDAC5. n = 4 from two independent experiments. (C-E) RAW264.7 cells were left untreated or were stimulated with LPS or CpG before expression levels of HDAC5 mRNA were determined by qPCR relative to the untreated samples. (C) Endpoint after 24 hrs LPS treatment. n = 8 from two independent experiments. (D) Kinetics between 0 and 7 hrs LPS treatment. n = 13 from six independent experiments. (E) Kinetics between 0 and 60 min. LPS treatment. n = 4 from two independent experiments. (F) Kinetics between 0 and 7 hrs CpG treatment n = 5 from three independent experiments. (G) Kinetics between 0 and 60 min. CpG treatment n = 6 from three independent experiments. (H) Kinetics between 7 and 14 hrs LPS treatment, 105 cells per slot, y-axis shows HDAC band intensity relative to the corresponding b-actin band, n = 2. Median values and ranges. *P < 0.05, **P < 0.01, ***P < 0.001 by Kruskal–Wallis test and Mann–Whitney test as post test.