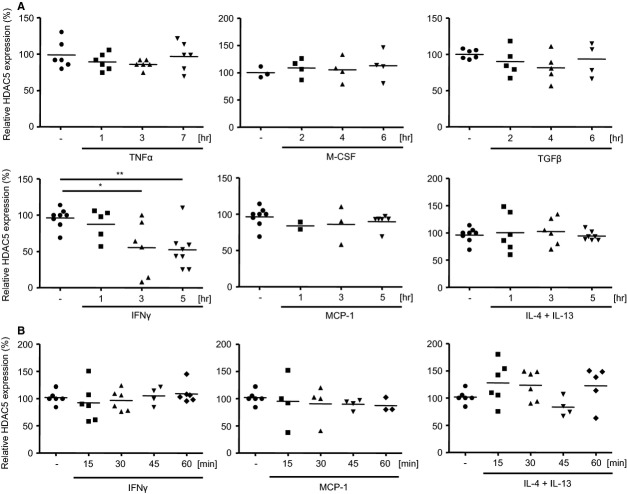
Figure 2.
Kinetics of HDAC5 mRNA expression in RAW264.7 cells after cytokine stimulation. (A) Cells (106) were incubated either in absence or presence of TNFα, M-CSF, TGFβ, IFNγ, MCP-1 or IL-4 + IL-13 for up to 7 hrs as indicated. (B) RAW264.7 cells were stimulated with IFNγ, MCP-1 or IL-4 + IL-13 for up to 60 min. as indicated. Expression levels of HDAC5 mRNA were determined by qPCR relative to the untreated samples. Median values and ranges of n = 2–8 from 2–4 independent experiments. *P < 0.05, **P < 0.01 Kruskal–Wallis test and Mann–Whitney test as post-test.

