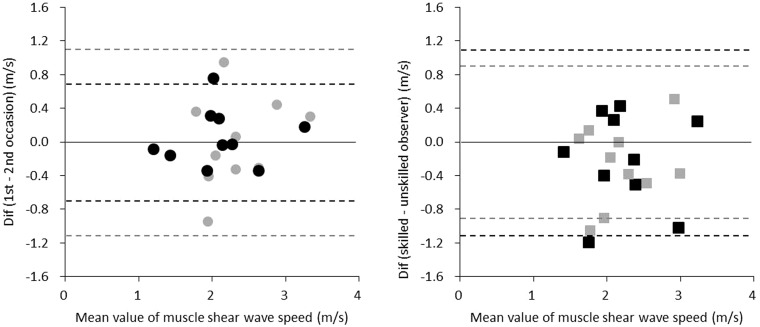
Fig. 2.
Bland-Altman plots. The left and right panels represent the inter-day reliability (black circle: skilled operator, gray circle: unskilled operator) and inter-operator reliability (black square: first occasion, gray square: second occasion), respectively. Dotted lines represent 1.96 standard deviations.

