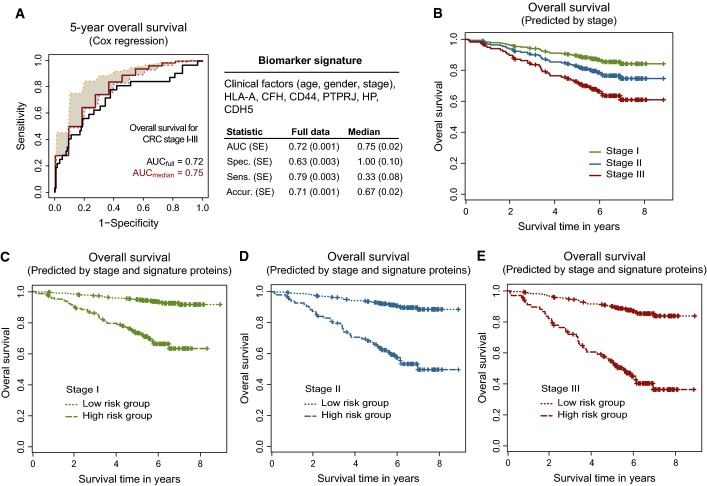
Figure 2. Biomarker signature of CRC outcome.
- A Biomarker signature containing clinical factors and biomarker candidates predicting 5-year overall survival. The summary statistics obtained on the cross-validated pseudomedian validation fold (i.e. between fold median; labeled in red), corresponding 25th (in magenta) and 75th (in orange) percentile bounds, and on the full dataset for the consensus model (i.e. biomarker signature; labeled in black). SE was calculated by bootstrap (see methods) for full dataset and from the ten folds for the pseudomedian. SE, standard error; spec., specificity; sens., sensitivity; accur., accuracy.
- B–E All collected survival data were used to plot predicted survival based on the Cox model fitted with the following: (B) stage I, II, or III (Cox model: 0.018*age – 0.006*gender(1 = male, 0 = female) + 0.368*stage; fixed parameters: age = 68, gender = male, stage = I or II or III); (C) stage I and signature proteins; (D) stage II and signature proteins; and (E) stage III and signature proteins. The signature proteins represent a linear combination of protein intensities (0.739*HLA-A – 1.143*CFH + 0.811*CD44 + 0.334*PTPRJ + 0.398*HP – 0.869*CDH5). The cutoff of −0.037 used for prediction is the median of individual predictions for all patients in stages I+II+III. HIGHprot represents a high-risk group of patients with individual predictions ≥ cutoff and LOWprot represents a low-risk group of patients with individual predictions < cutoff. The Cox model used in (C–E): 0.018*age – 0.006*gender (1 = male, 0 = female) + 0.368*stage – 1.735*LOWprot; fixed parameters: age = 68, gender = male, stage = I or II or III; and LOWprot versus HIGHprot is plotted.

