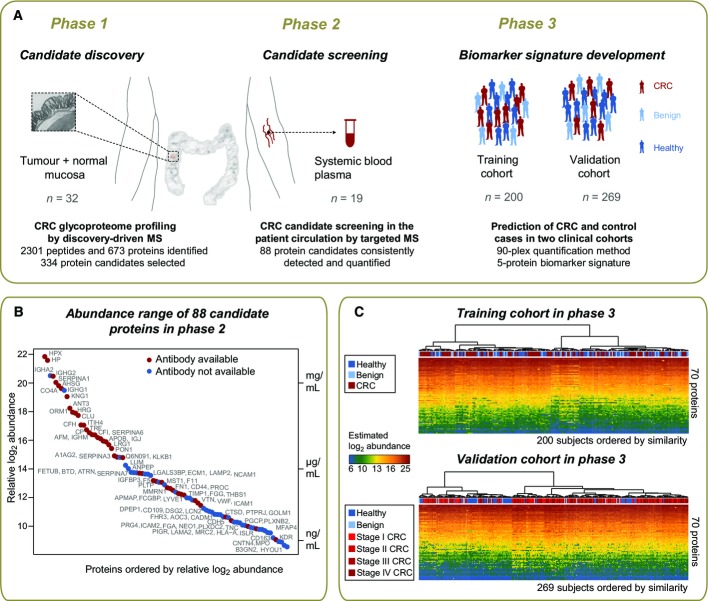
Figure 1. Phased proteomic workflow for the development of predictive biomarkers for colorectal cancer detection.
- Biomarker candidates were first characterized in the tumor and normal tissue epithelia by discovery-driven mass spectrometric (MS) profiling of the glycoproteome and then screened in patient plasma by targeted MS via selected reaction monitoring (SRM). The detectable proteins in plasma were subjected to large-scale quantification across two clinical cohorts of samples comprised of subjects with CRC, subjects with benign conditions, and healthy subjects. The data were used to develop and validate a protein biomarker signature.
- The relative abundances of protein biomarker candidates detected and quantified in patient circulation were estimated on a relative scale using linear mixed modeling. The y-axis on the right side of the plot annotates the proteins with measured concentrations by immunoassays in plasma (Haab et al, 2005; Polanski & Anderson, 2007; Hortin et al, 2008). The proteins span a concentration range of 5–6 orders of magnitude. Red dots indicate proteins with available immunoassays in plasma, and blue dots indicate proteins without such immunoassays.
- The generated quantification data are presented for the training and validation datasets, and the disease status of samples is labeled with red for CRC subjects, light blue for subjects with benign conditions, and dark blue for healthy subjects. Hierarchical clustering with Euclidian distance and Ward linkage was employed to cluster samples by similarity of protein abundance.

