
Figure 2. Transient expression of phagocytic molecules and exposure of the “eat-me” signal phosphatidylserine (PS) in the outer nuclear layer during rod degeneration.
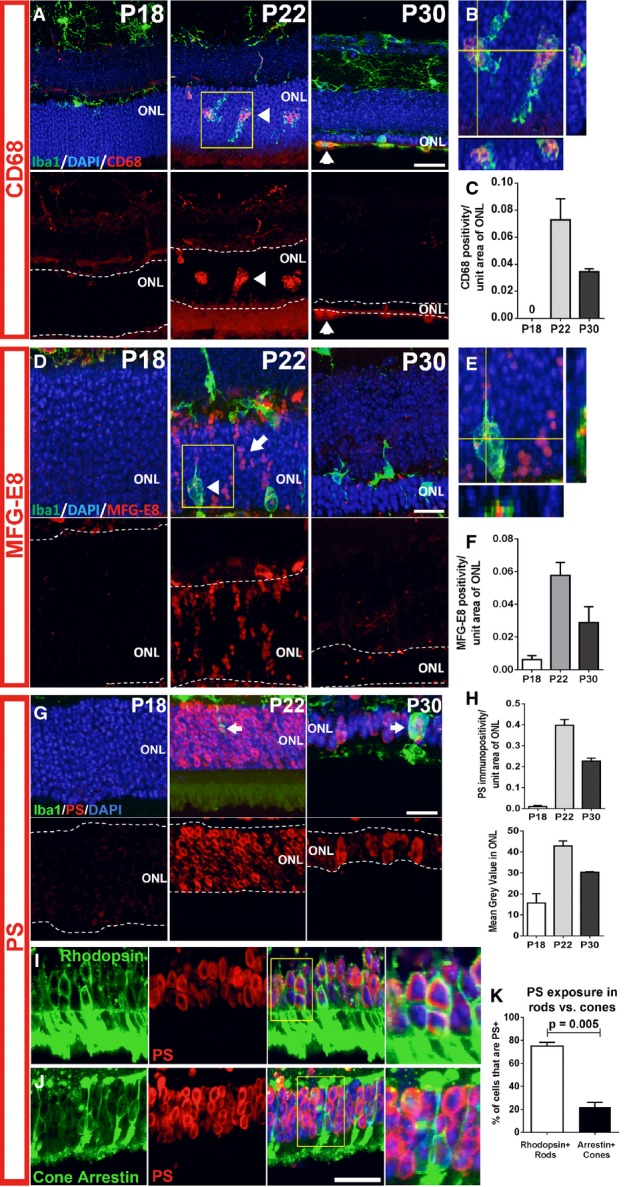
- A–C Microglia infiltrating the ONL demonstrate upregulation of the phagocytic molecule, CD68. Top images in (A) show composites of CD68 (red), Iba1 (green), and DAPI (blue) staining; bottom images show the same field with CD68 staining only. At P18, non-infiltrating microglia expressed low or undetectable levels of CD68, a lysosome-associated membrane protein. At P21–23, microglia infiltrating the ONL strongly upregulated CD68 (arrowheads). At P30, CD68 immunopositivity in ONL microglia decreased and was mostly confined to amoeboid cells in the subretinal space. (B) Magnified view of inset in (A) demonstrates localization of CD68 to microglia phagosomes. (C) CD68 expression (area of immunopositivity as a fraction of the ONL) demonstrated a peaked at P22 and decreased by P30. Scale bar, 20 μm.
- D–F Upregulation of MFG-E8, a secreted glycoprotein that serves as a bridging molecule for phagocytosis receptors, in the ONL. (D) MFG-E8 was low or absent in the ONL at P18, but emerged at P21–23, localizing to photoreceptor cell bodies in a column-like pattern (arrow) and as a punctate signal within infiltrating microglia (arrowhead), before decreasing throughout the ONL at P30. (E) A magnified orthogonal view of the inset from (D) demonstrating punctate MFG-E8 immunopositivity within ONL microglia. (F) Quantification of MFG-E8 expression demonstrated a prominent emergence at P22 and a subsequent decrement by P30. Scale bar, 20 μm.
- G–K Increase in phosphatidylserine (PS) exposure in the ONL during photoreceptor degeneration. (G) At P18, PS immunopositivity is near absent in the ONL, but increased significantly in ONL somata at P21–23, before decreasing at P30. (H) Quantitation of PS exposure by image analysis (by fractional area of PS immunopositivity within the ONL (top), and the mean intensity of PS staining in the ONL (bottom)) demonstrated a transient increase at P22. (I) Co-immunolabeling of rods with rhodopsin at P22 demonstrates that PS exposure was present in a majority of rods (inset shows at high magnification the co-labeling of PS and rhodopsin in multiple rod somata). (J) Conversely, immunolabeling of cones with cone arrestin demonstrates the sparse co-localization of PS in cones (inset shows close juxtaposition but no colocalization of PS and arrestin labeling). (K) Scoring of rhodopsin+ rods and arrestin+ cones for PS co-labeling demonstrates that a large majority of rods, but only a small minority of cones, showed PS exposure (two-sided unpaired t-test, n = 3 animals at P22). Scale bars = 20 μm.
Data information: Quantitative analyses in (C, F, H, and K) involved three animals at each time point. Column heights and error bars indicate mean ± SEM.