
Figure 6. Genetic ablation of microglia in the retina ameliorates photoreceptor degeneration in rd10 mice.
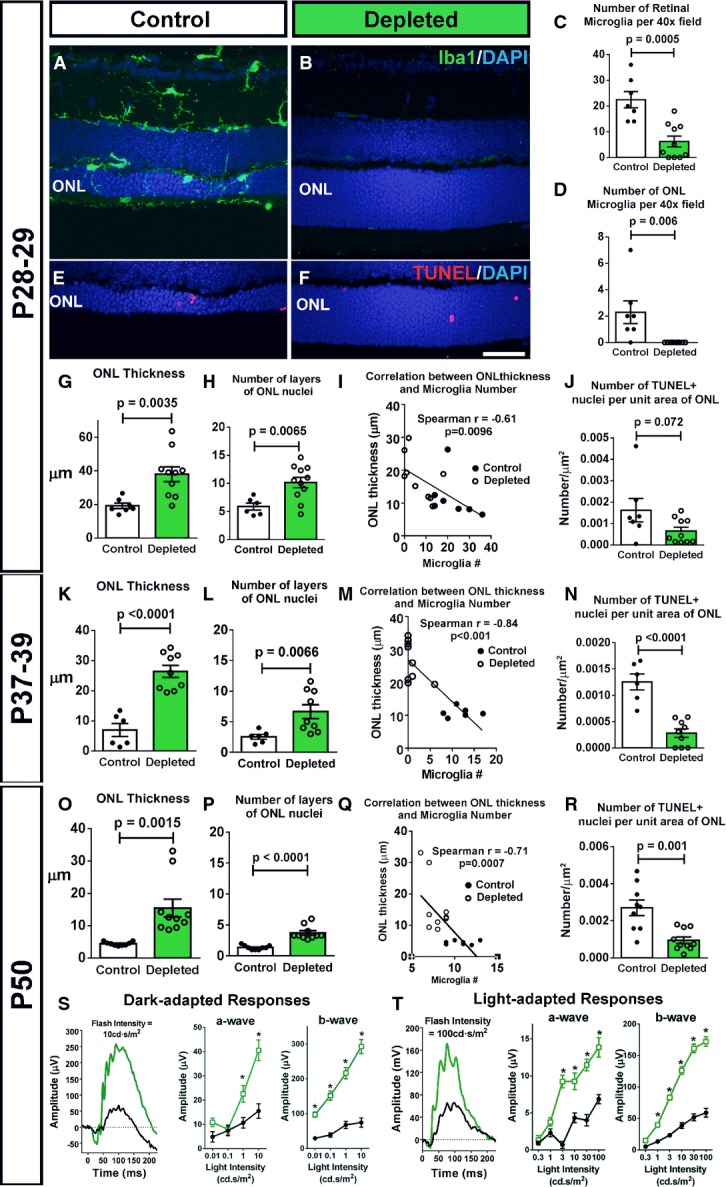
Retinal microglia were depleted in rd10/CreDTA mice by the oral administration of tamoxifen (in corn oil) to activate microglia-specific Cre-mediated recombination and diphtheria toxin expression; control CreDTA littermates were administered corn oil without tamoxifen.
- A–D Depletion of retinal microglia in the rd10 retina. Representative retinal section from a P28 control animal demonstrates Iba1+ microglia in the retina, including those infiltrating the ONL (A), while a tamoxifen-administered littermate (B) was substantially depleted of retinal microglia. Scale bar, 40 μm. Microglial cell counts in the entire retina (C) and in the ONL only (D) confirmed efficient depletion of infiltrating microglia following tamoxifen administration (n = 8 control and 11 depleted animals from four litters, two-sided unpaired t-test).
- E–J Effect of microglial depletion on retinal degeneration at P28–29. ONL atrophy and thinning in control animals (E) was significantly more advanced relative to microglia-depleted littermates (F). Scale bar, 40 μm. Quantification of mean ONL thickness (G) and mean number of layers of ONL nuclei (H) at P28–29 demonstrate significantly greater ONL preservation in depleted retinas; the degree of ONL preservation correlated with the extent of microglia depletion (I). (J) The mean density of TUNEL+ nuclei in the ONL was not significantly decreased in depleted vs. control animals (n = 8 control and 11 depleted animals from four litters, two-sided unpaired t-test).
- K–N Continuation of microglial depletion until P37–39 resulted in the persistence of morphological rescue (K–M), with a significant reduction in TUNEL+ nuclei density (N) (n = 6 control and nine depleted animals from two litters, two-sided unpaired t-test).
- O–R Similar rescue effects as in (K–N) remained apparent when depletion was sustained until P50 (O–R), a time when rod degeneration in the rd10 model is relatively complete (n = 9 control and 10 depleted animals from three litters, two-sided unpaired t-test).
- S, T Functional rescue of photoreceptors was evident following microglial depletion until P50 in significantly increased dark- (S) and light-adapted (T) responses in ERG testing in depleted animals (green lines) relative to control animals (black lines), in both a- and b-wave amplitudes across multiple flash intensities (n = 9 control and nine depleted animals, *P < 0.05 in one-way ANOVA with Sidak’s multiple comparison test).
Data information: Column heights (in C, D, G, H, J, K, L, N, O, P, R) and data points (in S, T) indicate mean, error bars indicate ± SEM.