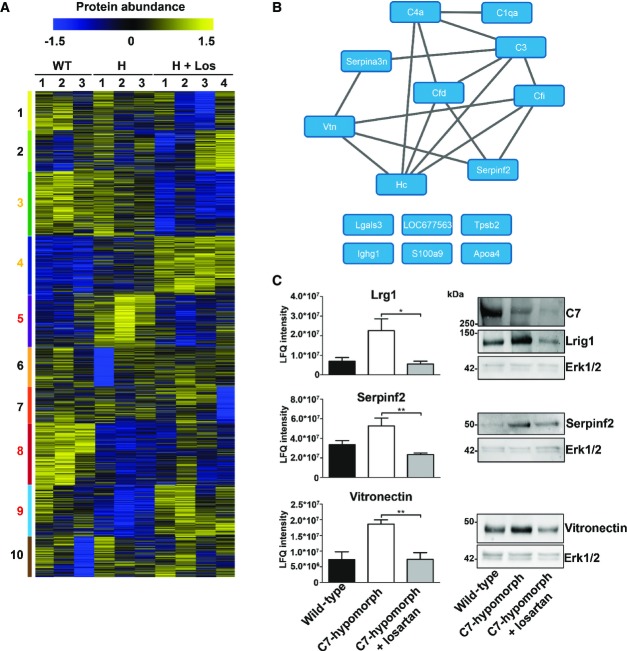
Figure 6. Proteomics analysis reveals losartan-mediated reversion of early fibrotic changes in RDEB.
- Heat map of cluster analysis of protein abundances determined by label-free quantification mass spectrometry. Extracted ion currents were used to determine protein abundances, and respective intensities were log2-transformed and normalized (z-score). Samples were clustered hierarchically, and protein abundances were clustered by k-means. Cluster sizes are indicated by color code on the left. Clusters 3, 4, 5, 8, and 9 highlight losartan-induced changes. The general patterns of protein abundance in clusters 5, 8, and 9 are similar in wild-type and losartan-treated C7-hypomorphic mice and thus contain downstream targets of losartan involved in RDEB disease progression. WT, wild-type; H, hypomorphic; H + Los, losartan-treated C7-hypomorphic skin.
- Proteins from cluster 5 carrying GO terms related to inflammation were short-listed and analyzed on potential interactions using default settings in STRING DB (confidence score 0.4) (Szklarczyk et al, 2015).
- Bar graphs show abundance of selected representative proteins in cluster 5 that were normalized by losartan treatment. Shown to the left are the mean ± S.E.M. of the normalized protein abundance (LFQ intensity) of groups of individual mice corresponding to wild-type, untreated, and losartan-treated C7-hypomorphic mice as indicated in the figure. Unpaired t-test was used to calculate significance. Abundance of Lrg1: *P-value C7-hypomorphic vs. losartan-treated C7-hypomorphic mice = 0.022; abundance of serpin f2: **P-value untreated C7-hypomorphic vs. losartan-treated C7-hypomorphic mice = 0.0084; abundance of vitronectin: **P-value untreated C7-hypomorphic vs. losartan-treated C7-hypomorphic mice = 0.0094. Right, validation of proteomics analysis by Western blotting of independent biological replicates. Representative Western blots of skin lysates from wild-type, untreated C7-hypomorphic, and 7-week losartan-treated C7-hypomorphic mice not used for proteomics. Blots were probed with antibodies against proteins as indicated. Erk1/2 and β-tubulin served as loading controls. The analysis shows that there is a good correlation between proteomics data and abundance detected by Western blotting (n = 3 per group).
Source data are available online for this figure.

