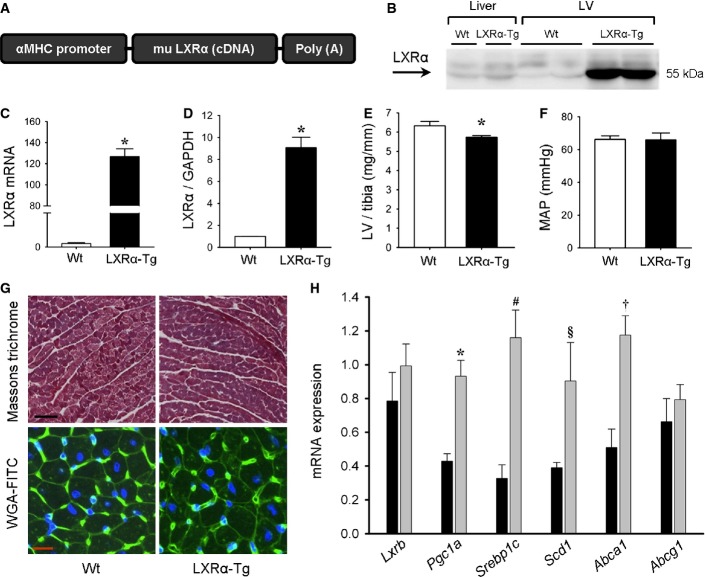
Figure 1. Baseline characterization of mice with cardiac-specific LXRα overexpression.
- A Murine LXRα DNA construct for the generation of transgenic (LXRα-Tg) mice.
- B–D Left ventricular LXRα expression in Wt and LXRα-Tg mice aged 12 weeks. (B) Western blot of LXRα in liver and LV tissue. Quantification of (C) mRNA expression (normalized to 36b4; n = 6–8/group, *P < 0.00001 versus Wt) and (D) protein expression (normalized to GAPDH; n = 4/group, *P = 0.0001 versus Wt).
- E LV weight to tibia length ratios (LV/tibia); n = 15/group. *P = 0.02.
- F Assessment of mean arterial pressure (MAP) with in situ catheterization shows no significant differences.
- G Representative Masson’s trichrome and wheat germ agglutinin (WGA)-FITC staining in cross-sectional LV, scale bars = 100 μm and 10 μm, respectively.
- H Relative mRNA levels of known LXRα-associated and target genes assessed with RT–PCR; n = 8/group. *P = 0.0003, #P = 0.0004, §P = 0.043, †P = 0.0009 versus Wt.
Data information: Data are means ± SEM; Student’s paired 2-tailed t-test was used to compare groups. Source data are available online for this figure.

