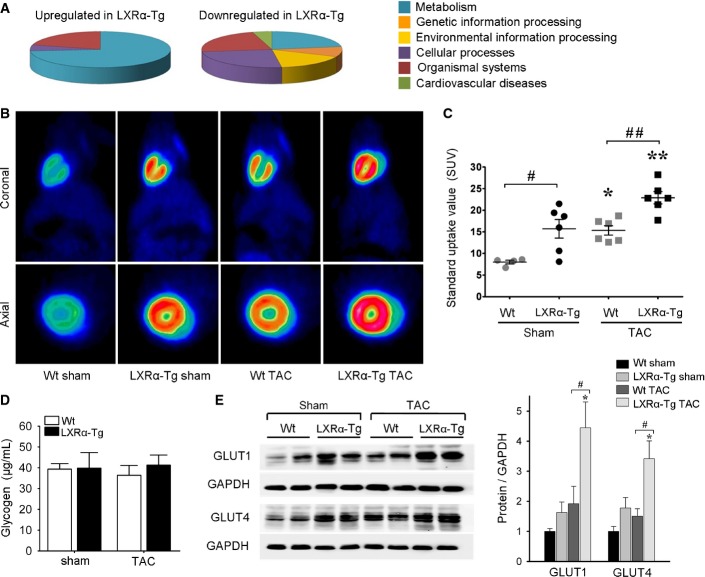
Figure 4. Cardiac LXRα overexpression enhances myocardial glucose uptake.
- Classification of genes differentially expressed in LXRα-Tg hearts (see Supplementary Fig S3).
- Representative 18F-FDG images with microPET in the coronal and axial planes in Wt and LXRα-Tg mice 5 weeks post-TAC.
- Myocardial FDG uptake measured as standard uptake value (SUV); n = 4–6/group. *P = 0.04 versus Wt sham, **P = 0.02 versus LXRα-Tg sham, #P = 0.03, ##P = 0.01.
- Quantification of myocardial glycogen content shows no significant differences; n = 5 per sham group, n = 7 per TAC group.
- GLUT protein expression in LV tissue normalized to GAPDH; n = 6/group. Glut1: *P = 0.01 versus LXRα-Tg sham, #P = 0.03; Glut4: *P = 0.03 versus LXRα-Tg sham, #P = 0.01.
Data information: Data are means ± SEM; one-way ANOVA with Bonferroni’s multiple comparison test was used to compare groups. Source data are available online for this figure.

