
Figure 3.
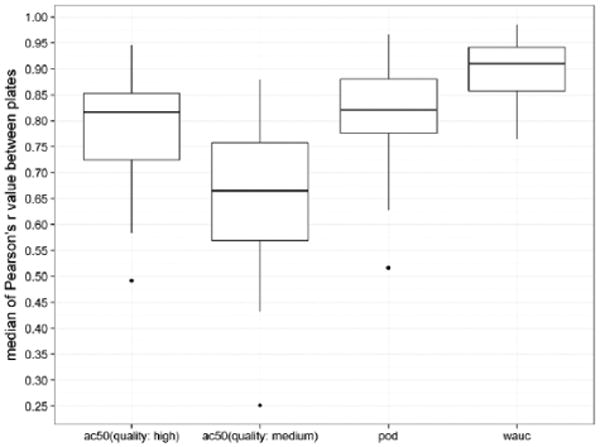
The signal reproducibility between nine plates and three batches across 32 assays using different activity metrics (weighted version of the area under the curve (wAUC), point of departure (POD), and AC50) is presented as box-and-whisker plots. Each box-and-whisker-plot is constructed based on 32 median Pearson's r values from pairwise plate comparisons of each assay. The outliers shown in the plots are all viability assays: mitochondria membrane potential (high-quality AC50), glucocorticoid receptor antagonism (medium-quality AC50), and androgen receptor (full-length) antagonism (POD).