
Table 2.
Challenges in quantitative high-throughput screening data analysis.a.
| Challenge Description | True Signal/Activity | False Signal/Assay Interference |
|---|---|---|
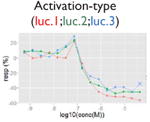
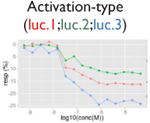
| Nonmonotonic curve: U-shape |
|
|
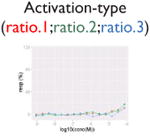
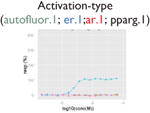
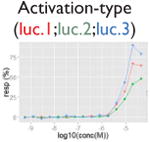
| Identification of weak signal |
|
N/A |
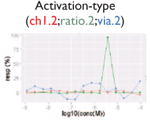
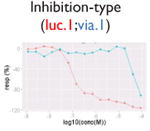
| Assay interference: cytotoxicity |
|
|
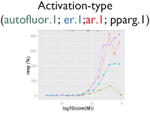
| Assay interference: autofluorescence |
|
|
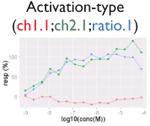
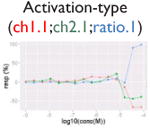
| Assay interference: contradictory readout |
|
|
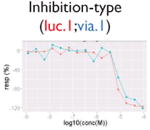
| Assay interference: reverse signal |
|
|
a
Ratio or luc, main readout in either β-lactamase assay or luciferase assay, respectively; ch1, channel 1, the background in bla (β-lactamase assay) assay; ch2, channel 2, the signal channel in bla assay; via, cell viability; autofluor, autofluorescence; er, estrogen receptor; ar, androgen receptor; pparg, peroxisome proliferator-activated receptor gamma. Numbers represent different batches.