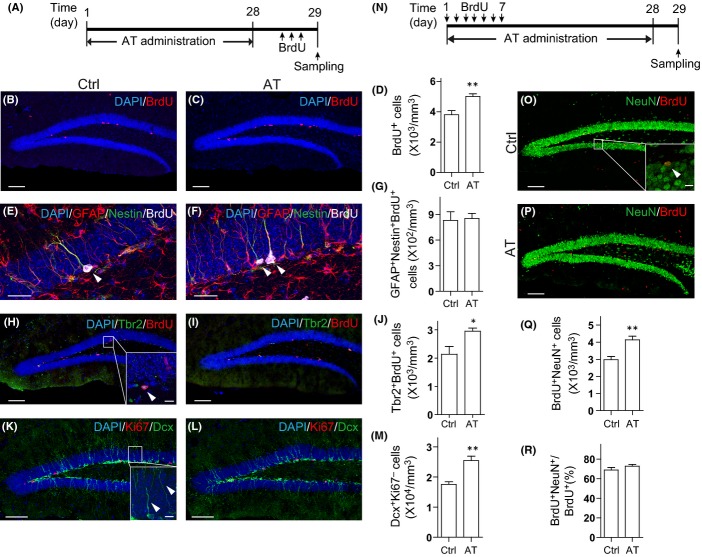
Fig 1.
The extract of Rhizoma Acori tatarinowii (AT) promotes neural progenitor cell (NPC) proliferation and neurogenesis in adult mouse hippocampus. (A) Diagram depicting the experimental design employed for investigating NPC proliferation. (B, C) Immunostaining for BrdU (red) and DAPI (blue) in coronal hippocampal dentate gyrus (DG) sections from mice treated with (B) vehicle (Ctrl) and (C) AT as indicated in (A). Scale bars, 100 μm. (D) Quantification of BrdU+ cells from sections as in (B, C). N = 5 to 6 per group. (E, F) Immunostaining for GFAP (red), Nestin (green), and BrdU (grey) in DG sections from mice treated with (E) vehicle (Ctrl) and (F) AT. Scale bars, 25 μm. (G) Quantification of GFAP+Nestin+BrdU+ cells. N = 5 to 6 per group. (H, I) Tbr2 (green), BrdU (red), and DAPI (blue) co-staining of DG sections from mice treated with (H) vehicle (Ctrl) and (I) AT. Scale bars, 100 μm. (J) Quantification of Tbr2+BrdU+ cells. N = 5 to 6 per group. (K, L) Ki67 (red), Dcx (green), and DAPI (blue) co-staining of DG sections from mice treated with (K) vehicle (Ctrl) and (L) AT. Scale bars, 100 μm. (M) Quantification of Dcx+Ki67− cells. N = 5 to 6 per group. (N) Diagram depicting the experimental design employed for examining NPC differentiation. (O, P) BrdU (red) and NeuN (green) staining of DG sections from mice treated with (O) vehicle (Ctrl) and (P) AT. The experiment was performed as depicted in (N). Scale bars, 100 μm. (Q) Quantification of BrdU+NeuN+ cells from sections as in (O, P). N = 7 per group. (R) Proportion of BrdU+NeuN+ cells in BrdU+ cells. N = 7 per group. Insets were images of high magnification with scale bars of 10 μm. Quantifications are presented as mean ± SEM; *P < 0.05, **P < 0.01, analyzed by two-tailed t-test.

