Fig 3.
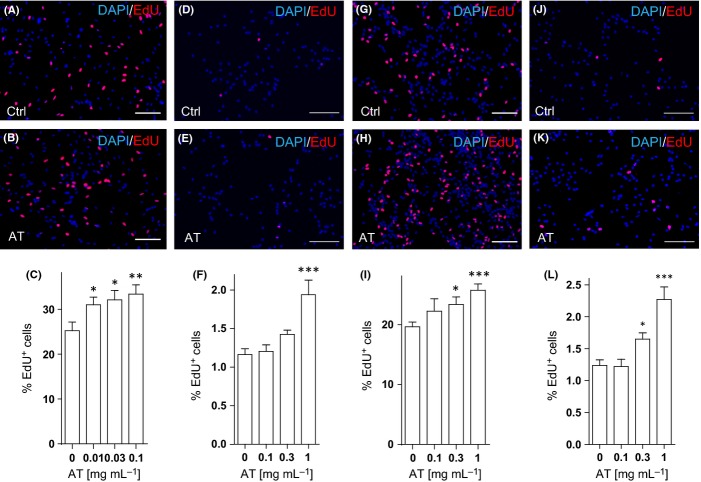
The extract of Rhizoma Acori tatarinowii promotes proliferation of neural progenitor cells (NPCs) in vitro. (A–C) Monolayer adult hippocampal NPC cultures were treated with AT of different concentrations for 24 h in the reduced growth factor medium (1 ng mL−1 EGF and 1 ng mL−1 bFGF). EdU was added 2 h prior to fixation. Representative images of EdU (red) and DAPI (blue) stainings in the culture treated with DMSO (Ctrl, A) or 0.1 mg mL−1 AT (B) were shown. The percentage of EdU+ cells among total cells in the culture (C) was determined. (D–F) Monolayer adult hippocampal NPC cultures were treated with AT of different concentrations for 14 h in the absence of EGF or bFGF. EdU was added 2 h prior to fixation. Representative images of EdU (red) and DAPI (blue) stainings in the culture treated with DMSO (Ctrl, D) or 1 mg mL−1 AT (E) were shown. (F) Quantification of EdU+ cells (as a percentage of total cells) in the culture. (G–I) Monolayer embryonic neural precursors were treated with AT for 24 h in the reduced growth factor medium. EdU was added 2 h prior to fixation. Representative images of EdU (red) and DAPI (blue) stainings in the culture treated with DMSO (Ctrl, G) or 1 mg mL−1 AT (H) were shown, and the percentage of EdU+ cells among total cells in the culture (I) was determined. (J–L) Embryonic neural precursors were treated with AT of different concentrations for 14 h in the absence of EGF or bFGF. EdU was added 2 h prior to fixation. Representative images of EdU (red) and DAPI (blue) stainings in the culture treated with DMSO (Ctrl, J) or 1 mg mL−1 AT (K) were shown. (L) Quantification of EdU+ embryonic neural precursors (as a percentage of total cells) in the culture. Quantifications are presented as mean ± SEM of eight independent experiments; *P < 0.05, **P < 0.01, ***P < 0.001, analyzed by one-way ANOVA followed by Fisher’s protected least significant difference test; scale bars, 100 μm.

