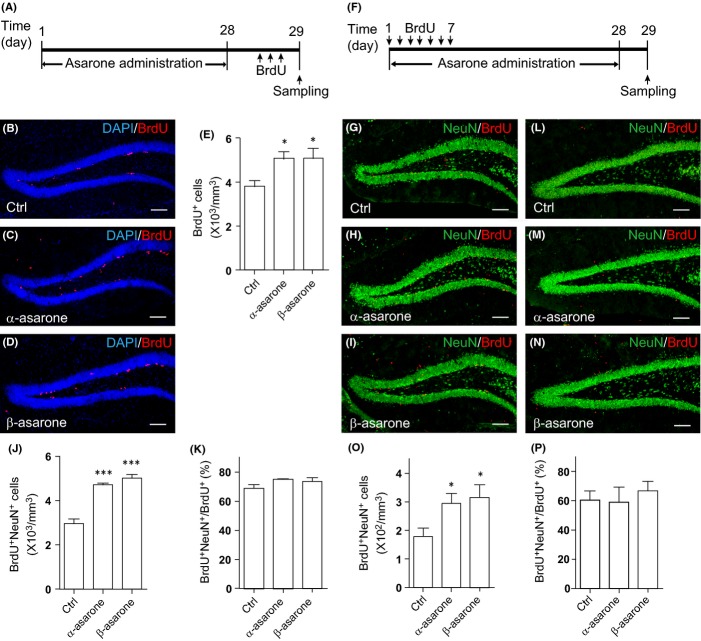
Fig 5.
Asarones enhance neural progenitor cell (NPC) proliferation and neurogenesis in mouse hippocampus. (A) Diagram depicting the experimental design employed for examining NPC proliferation. (B–D) BrdU (red) staining and DAPI (blue) counterstain of DG sections from 8-week-old mice treated with (B) vehicle (Ctrl), (C) α-asarone, or (D) β-asarone. The experiment was performed as depicted in (A). (E) Quantification of BrdU+ cells as in (B–D). N = 5–6 per group. (F) Diagram depicting the experimental design employed for examining NPC differentiation. (G–I) BrdU (red) and NeuN (green) stainings of DG sections from mice treated with (G) vehicle (Ctrl), (H) α-asarone, or (I) β-asarone. The experiment was performed as depicted in (F). (J) Quantification of BrdU+NeuN+ cells in (G–I). N = 4–7 per group. (K) Proportion of BrdU+NeuN+ cells in BrdU+ cells. N = 4–7 per group. (L–N) BrdU (red) and NeuN (green) stainings of DG sections from 18- to 23-month-old mice treated with (L) vehicle (Ctrl), (M) α-asarone, or (N) β-asarone. The experiment was performed as depicted in (F). (O) Quantification of BrdU+NeuN+ cells in (L–N). N = 5–7 per group. (P) Proportion of BrdU+NeuN+ cells in BrdU+ cells. N = 5–7 per group. Quantifications are presented as mean ± SEM; *P < 0.05, ***P < 0.001, analyzed by one-way ANOVA followed by Fisher’s protected least significant difference test; scale bars, 100 μm.

