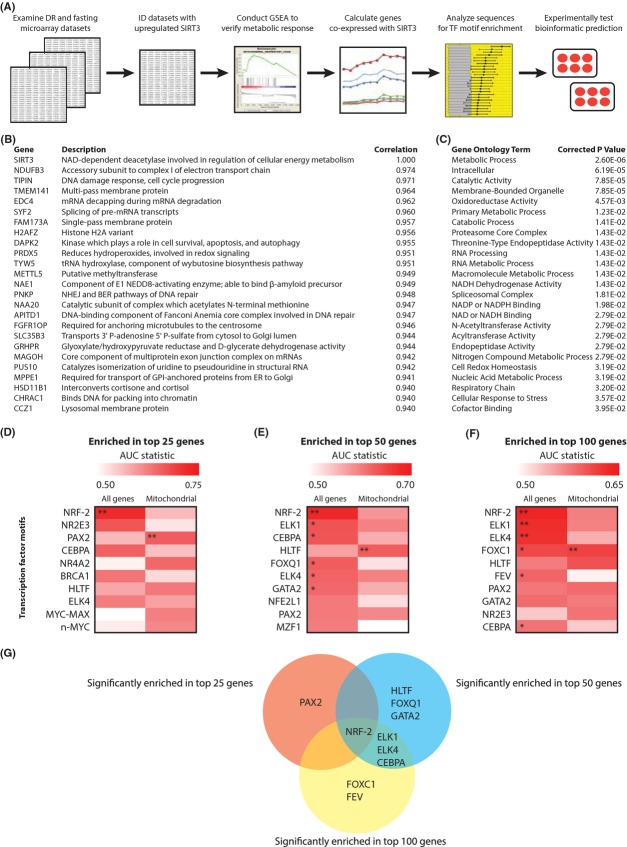
Fig 1.
Bioinformatic identification of NRF-2 binding site enrichment in DNA sequences of SIRT3 and co-expressed genes. (A) Overview of bioinformatic steps analyzing transcription factor binding motif enrichment in the DNA sequences of SIRT3 and co-expressed genes. (B) Top 25 most SIRT3-correlated genes (by Pearson’s r) in the mouse neocortex dataset. (C) Enrichment of selected gene ontology terms in top 50 most SIRT3-correlated genes in neocortex (full results in Table S2, Supporting information). (D–F) Heat maps of transcription factor motif enrichment in the (D) 25 most SIRT3-correlated genes, (E) 50 most SIRT3-correlated genes, and (F) 100 most SIRT3-correlated genes (by expression levels across samples) for the neocortex dataset. All genes = most SIRT3-correlated genes analyzed from all genes in dataset. Mitochondrial = most SIRT3-correlated mitochondrial genes analyzed in the dataset. Top ten motifs are shown, ordered by motif’s maximum AUC score, a measure of enrichment. Red = greater enrichment; white = less enrichment. * indicates q < 0.05; ** indicates q < 0.01. (G) Overlap of significantly enriched transcription factor motifs identified in (D–F), showing results from analyzing the 25 (red circle), 50 (blue circle), and 100 (yellow circle) most SIRT3-correlated genes for the neocortex dataset.

