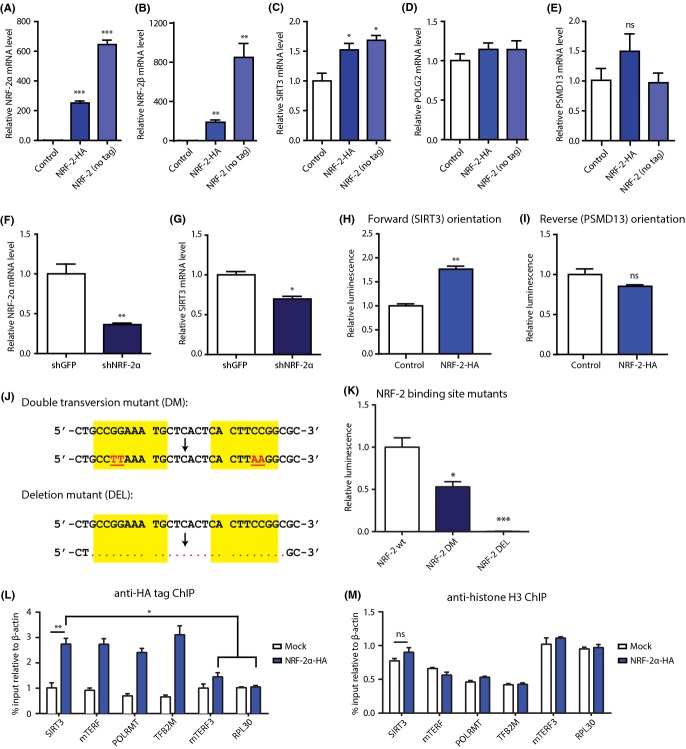
Fig 3.
Experimental investigation of NRF-2 control of the SIRT3 promoter. (A) Validation of NRF-2α overexpression and B) NRF-2β1 overexpression in 293T cells by quantitative PCR. The two subunits together compose NRF-2. (C) Effect of NRF-2 overexpression on mRNA levels of SIRT3, (D) mitochondrial DNA polymerase subunit γ-2 (POLG2), and (E) PSMD13. (F) Validation of NRF-2α knockdown in 293T cells and (G) effect on SIRT3 mRNA levels. (H) Relative luminescence from forward (SIRT3) and (I) reversed (PSMD13) bidirectional promoter luciferase reporter following the overexpression of vector control or NRF-2-HA in 293T cells. (J) Diagrams of changes introduced in two reporter constructs with mutated NRF-2 binding sites: a double transversion mutation (DM) and a 26-base pair deletion mutation (DEL). Mutations introduced are shown in red. NRF-2 binding sites are highlighted with a yellow background. (K) Relative luminescence from SIRT3 promoter reporter with wild-type sequence (NRF-2 wt), mutated NRF-2 binding sites (NRF-2 DM), or deleted NRF-2 binding sites (NRF-2 DEL). (L) Chromatin immunoprecipitation of HA tag in 293T cells following the overexpression of NRF-2α-HA, showing percent input (relative to β-actin) of SIRT3 and positive (mTERF, POLRMT, TFB2M) and negative (mTERF3, RPL30) NRF-2 controls. (M) Chromatin immunoprecipitation of histone H3 in 293T cells following the overexpression of NRF-2α-HA, showing percent input (relative to β-actin) of SIRT3 and positive and negative NRF-2 controls. For A–G, n = 3 samples per condition, and B2M was used as the reference gene; for H–K, n = 4 samples per condition; for L and M, n = 3 separate immunoprecipitations; and for all, bars are standard error. * indicates P < 0.05; ** indicates P < 0.01; and *** indicates P < 0.001. Two-tailed Student’s t-test was used for P values.

