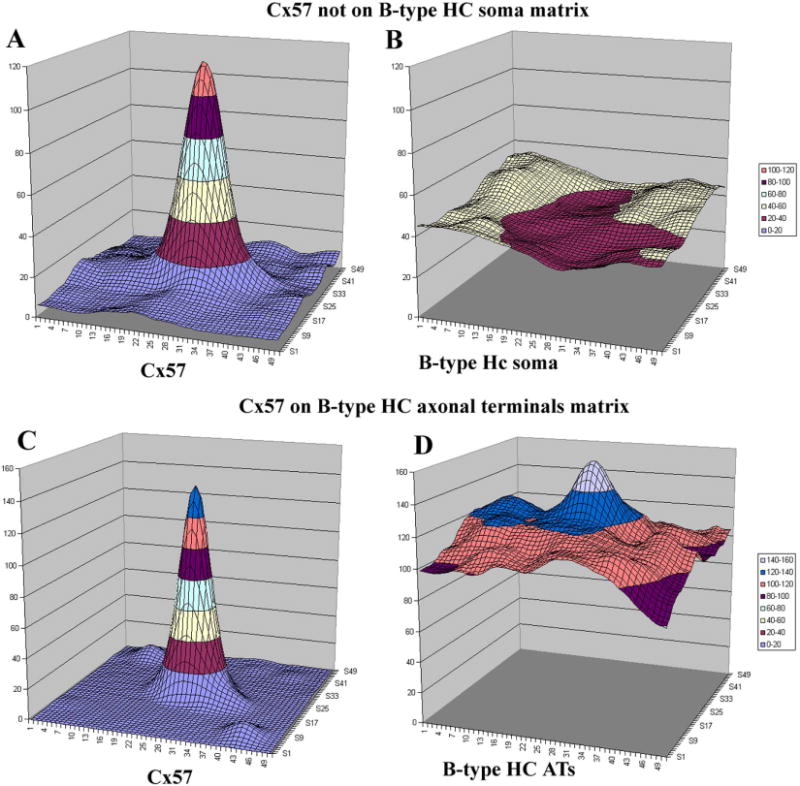
Figure 11.

Image analysis for Cx57. A: A 2-μm sampling box was centered over every Cx57 plaque in a single confocal image of the rabbit OPL. Aligning and signal averaging for the Cx57 plaques produced a strong central peak, as expected. B: The average distribution of a second channel, labeled for B-type somatic dendrites, around the central Cx57 peak. There was a central depression in the distribution of B-type somatic dendrites indicating anticorrelation with Cx57 gap junctions. C: The Cx57 peak obtained after selecting the Cx57 plaques in a single confocal image. D: The average distribution of the second cannel, labeled for the axon terminal plexus. There is a prominent peak in the center of the plot. This indicates there is a high probability that an axon terminal process is associated with each Cx57 plaque.
